Experimentation has the power to provide you with insights about your users, to let you rollout software safely, and to ensure that the features you are building are delivering value. But with this power comes great responsibility - it’s dangerously easy to be misled by the data. Are you making the right decisions based on your experiment results? Are you falling into the common traps of interpreting statistics?
Join an optimistic product manager, Sophie, and a pedantic data scientist, Lizzie, as this experimentation duo discuss and explain experimentation from all perspectives.
1 / 65 Use ← → to navigate
Auto-generated transcript - may contain errors.
Tap a timestamp to jump the video.
So think about your latest feature release. Who here understood its impact on users? Anyone? Not too many people? Okay. What about your latest deployment? Did you still understand its impact on users? Who would like who would like both of these things? Who would like to understand the impact, both for feature releases and deployment?
Great. Well, online experimentation can help you do exactly that. And as as we've said, with this great power comes great responsibility. Before we get started, I'll do a quick introduction to us. So Sophie and I both met whilst working at Skyscanner, working on the experimentation team there.
And now, as you heard, we work for Split. And Split is a feature fragging and experimentation company, so now we help other companies run their own experiments and optimize their products. One of the reasons we wanted to do a joint talk today is because coming from product and data science, we have quite different angles on experimentation, but we've both seen firsthand how powerful a tool it can be when it's used right, and how it can also sometimes be misleading.
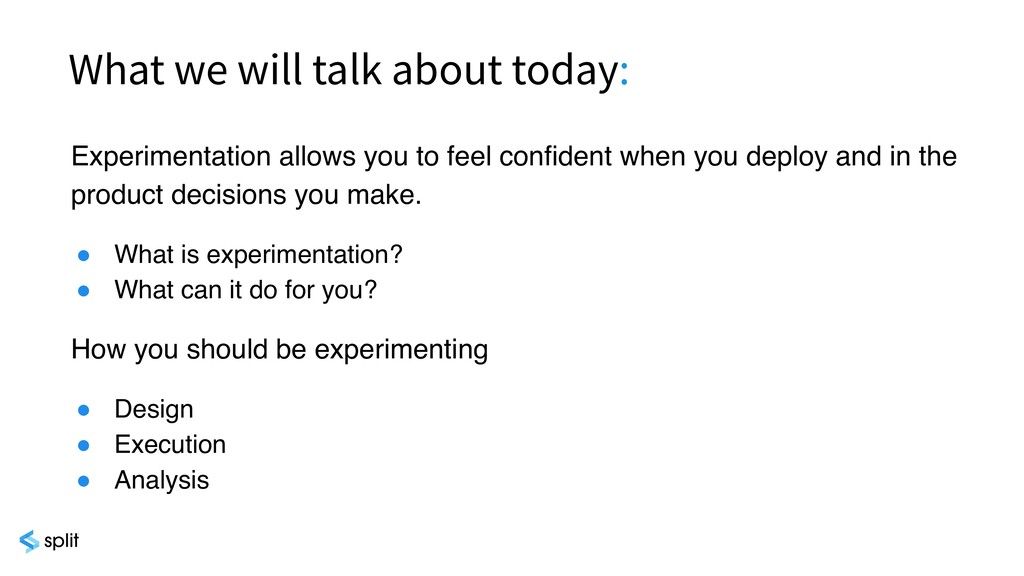
We also figured with two of us, there's more chance that you're like at least one of us. So, variant A or variant B. So, what we're going to talk about today is what experimentation is, what it can do for you, some tips and tricks along the way, and what pitfalls to avoid as well.
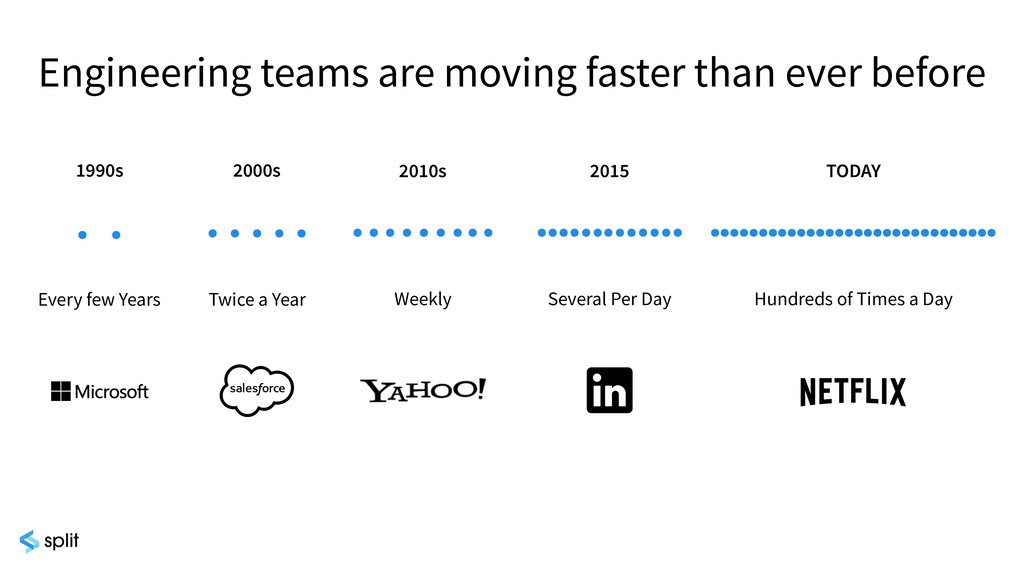
We're hoping this talk will be useful for people who are already experimenting, and people who are to experimentation as well. If we venture back to the early '90s, software updates were pretty rare. I quite like the idea of getting your AOL update in the post on a disk.
That sounds quite cool. And then we fast forward to today, companies like Netflix updating their software hundreds of times a day. Now, we might not all be at that stage, but we're all moving in that general direction. It's no no longer about these big releases every couple of years or so.
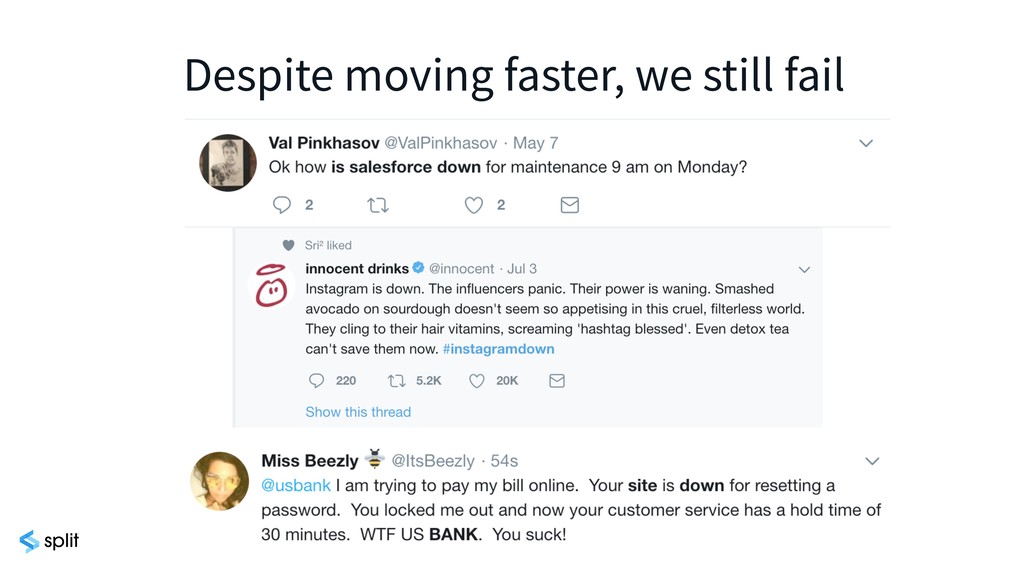
It's more about MVPs, iteration, and a high value placed on customer insights and feedback. So with all this speed, we're getting lots more value to customers. Right? Or are we just delivering ******** software? If you think about it, apps still fail, websites still crash.
When Instagram goes down, all of their social media platforms light up to complain that Instagram was down. When Slack was down a few weeks ago, our engineers didn't know what to do with themselves, how to communicate. All this speed doesn't mean that we're getting it right one hundred percent of the time.
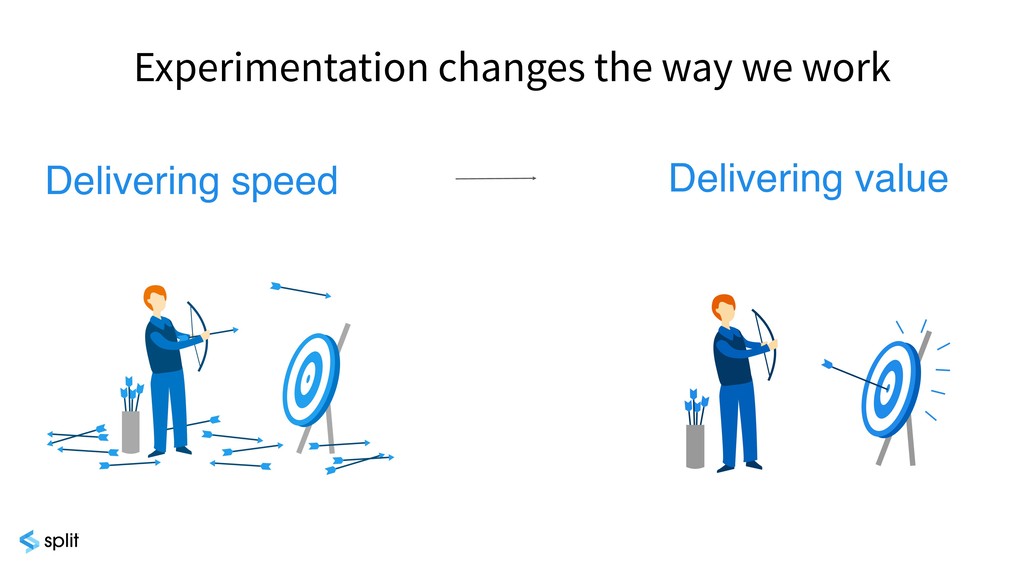
So the question is, how do we rapidly deliver valuable software, not just software in general? As Jeff was mentioning, it's more about being an outcome company rather than just output, and experimentation allows you to do that. So why do we need controlled experimentation?
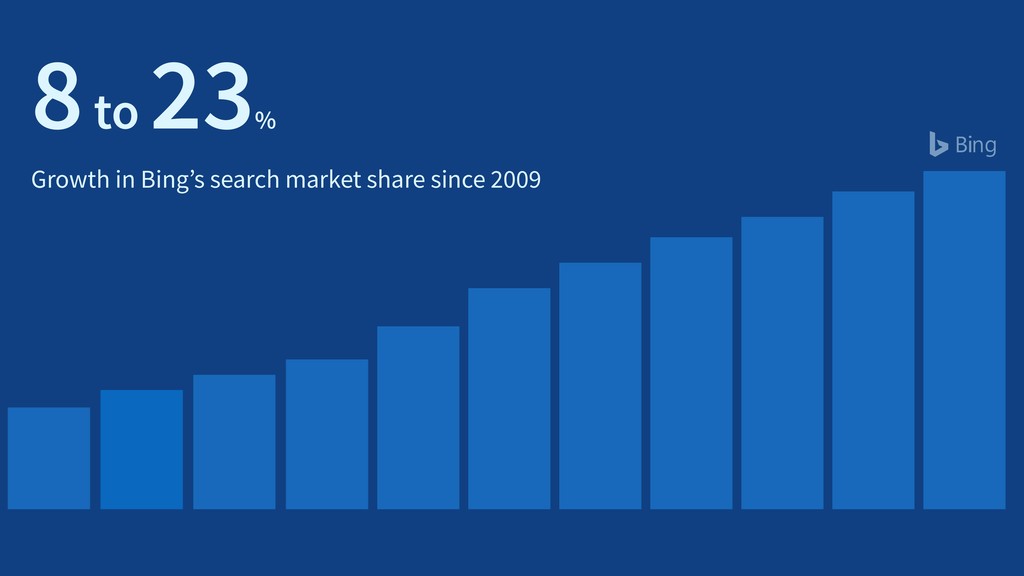
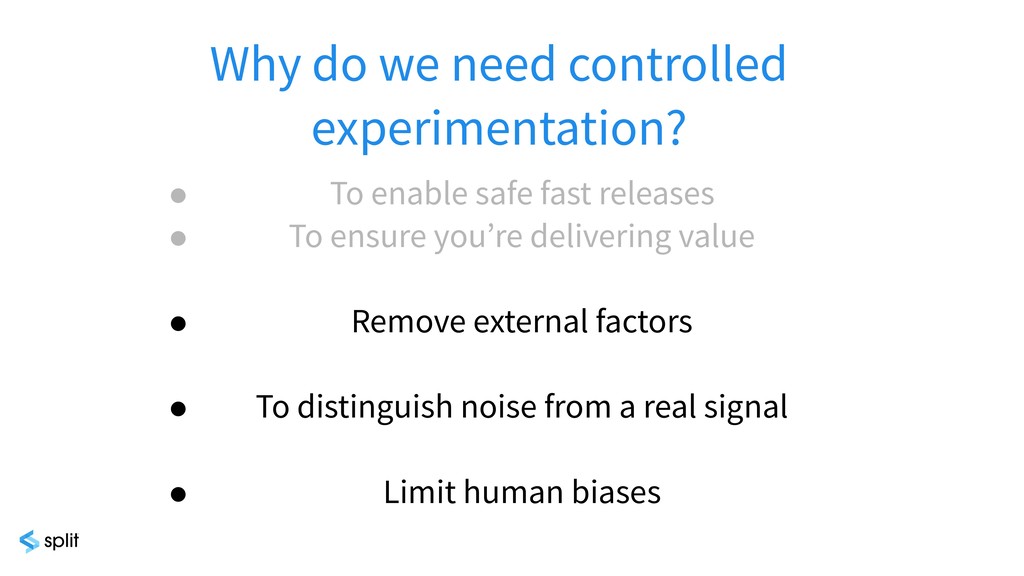
To enable safe, fast releases and ensure you're delivering value. So Bing started online experimentation in two thousand and nine, and they were able to increase their market share from eight to eight to twenty three percent. Now these numbers might not seem massive, but when you think about who their competition is, this is actually a really great achievement.
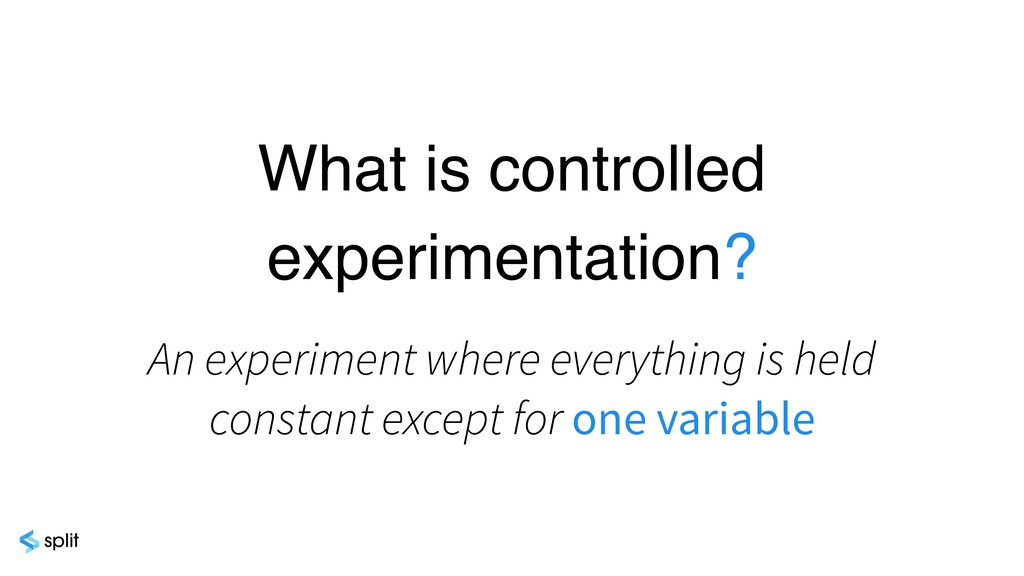
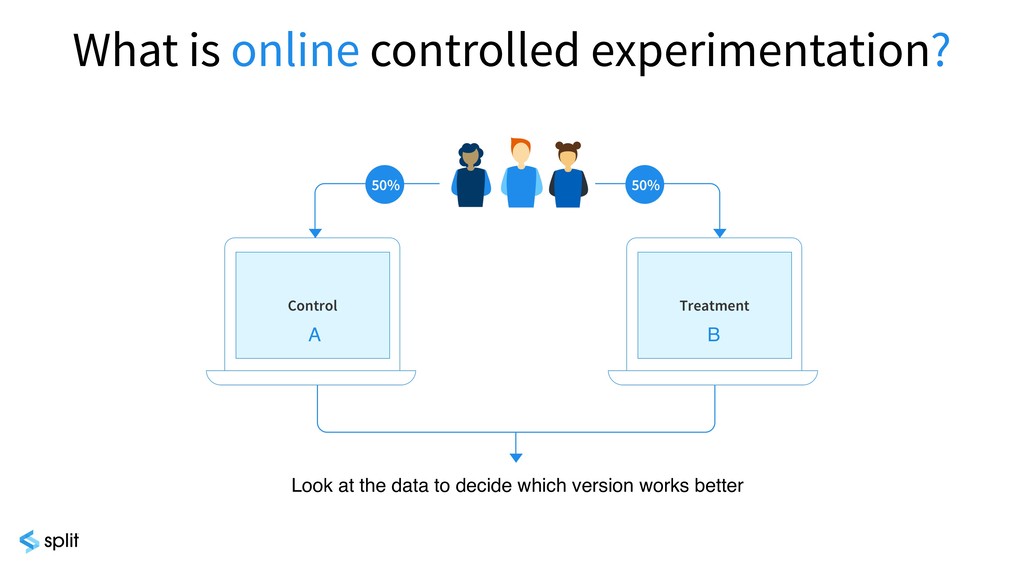
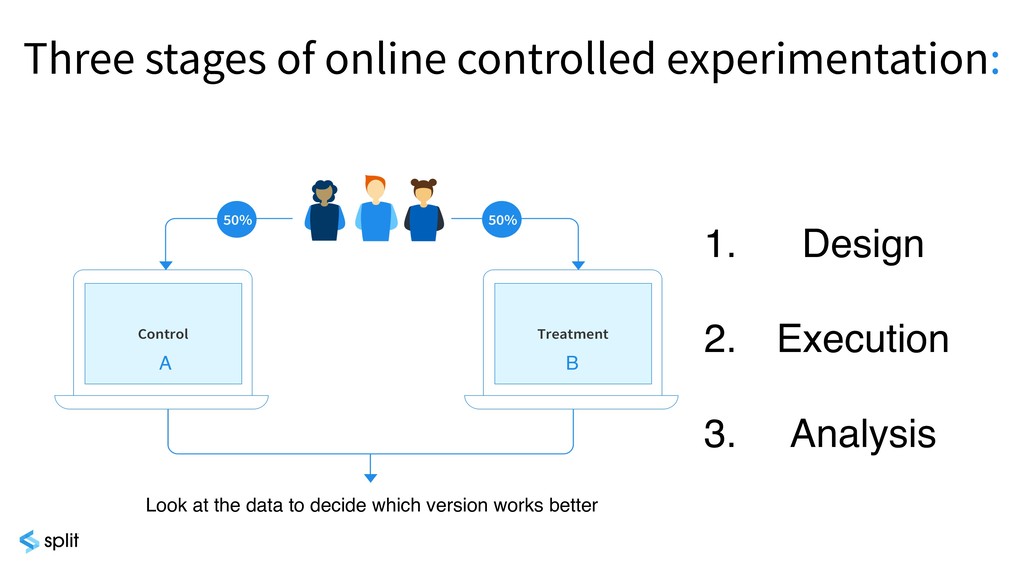
So we already said experimentation a bunch of times, but what do we actually mean? We mean specifically controlled experimentation. So this is just a test where everything is held constant except one thing. So that one thing that you're controlling. And then any differences that you see in the data or in the metrics can be directly attributed to that one thing.
And fun fact, so what's often cited as the first documented controlled experiment was actually run by a doctor from right here in our lovely hometown of Edinburgh. So the story goes that at a time when many sailors were dying from scurvy, this doctor noticed that fewer sailors were dying on Mediterranean ships.
So he hypothesized that the reason for this was because of the citrus diet, and then he ran a controlled experiment. So he gave some sailors on a particular voyage limes, and the rest ate their normal diet. And so the only difference there was the limes.
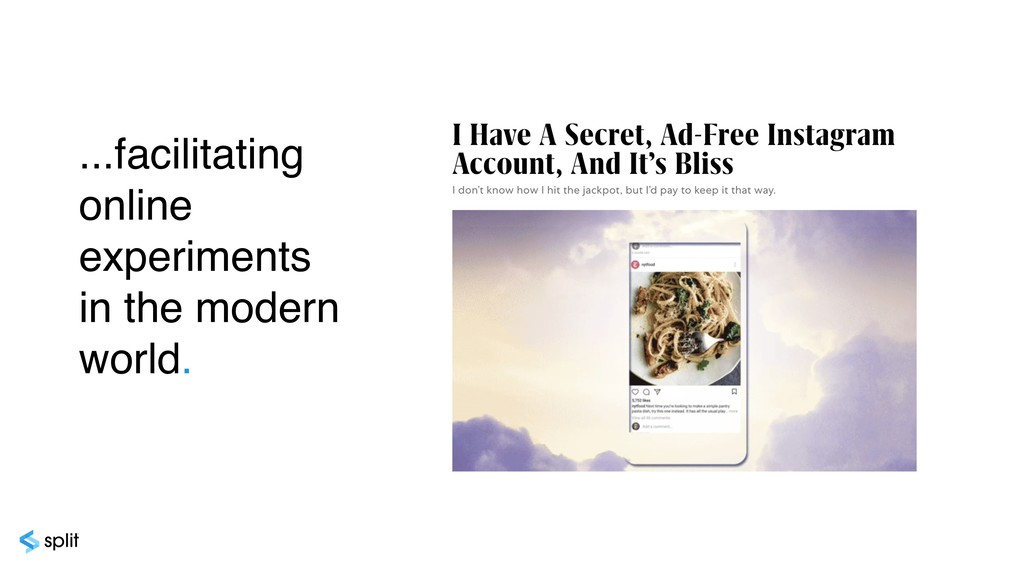
And this experiment was a great success, so it led to fewer sailors dying, and it's also where the British sailors get the nickname limes. And from this noble experiment of the seventeen hundreds was able to facilitate an online experiment of the modern world, where this guy hit the jackpot and got an ad free Instagram account, pretty good variant to be in.
Instagram probably testing out engagement rates and different metrics that they care about and seeing how ads interplay with this. And there's lots of experiments like this all around us. There's a great website, Experimentation Leaks, where you can see what big names are experimenting with and what variant you're in as well.
In kind of a tech context, online experimentation is sometimes called AB testing or split testing, and essentially just a tool that helps us make data driven decisions. It helps you decide what actions to take and how to optimize your product. At a high level, it's pretty simple.
So just when users come to your website or your product, you randomly assign them into a group. And then depending on which group they get randomly assigned to, they'll see a slightly different version of your product. So maybe a slightly different variant, a slightly different treatment is sometimes called, but they'll just have a slightly different experience.
So you let this run for a while, you collect the data at the end, and then you use that data to work out which of those versions worked better. And I want to add a few more reasons to Sophie's List of why we need to use or why we should be using controlled experimentation.
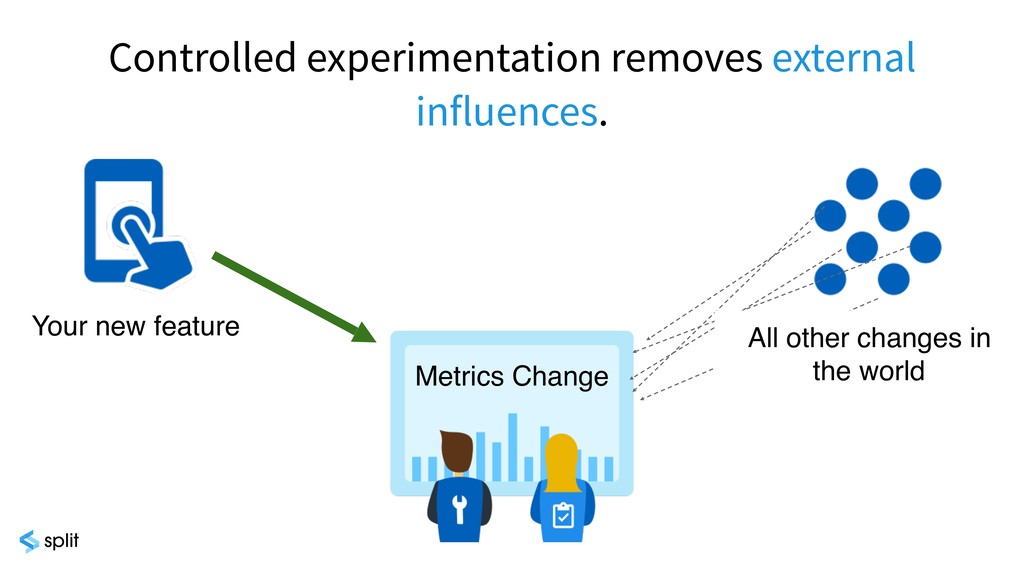
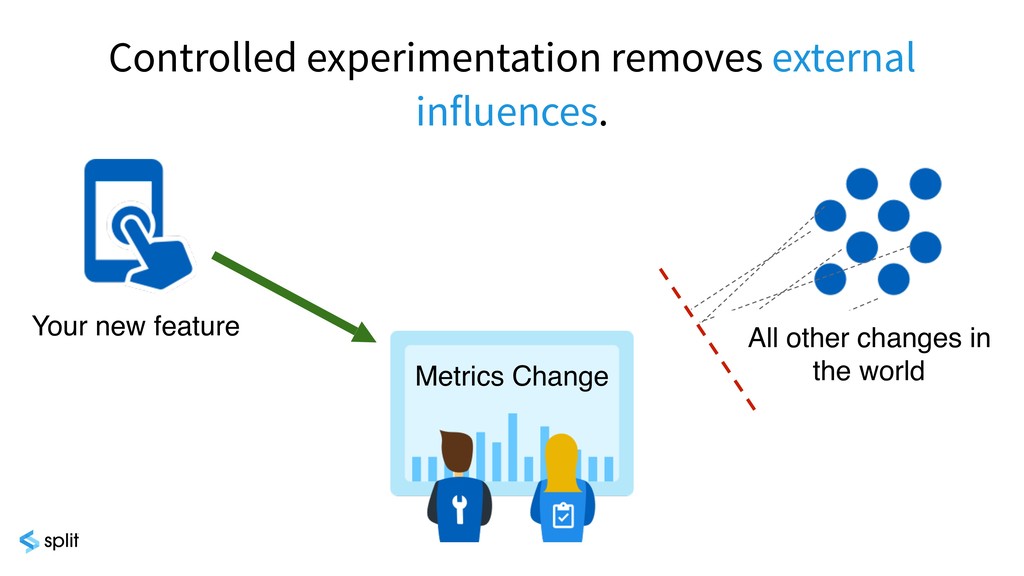
So it allows us to remove external influences. So rather than just releasing your new features and then looking at what happens to the metrics afterwards, It's much safer to do experimentation because any changes that you see in your metrics, they could be due to the feature that you just released, but they could also be due to changes in the weather, to different news stories, to plane crashes, to anything else that's going on in the world.
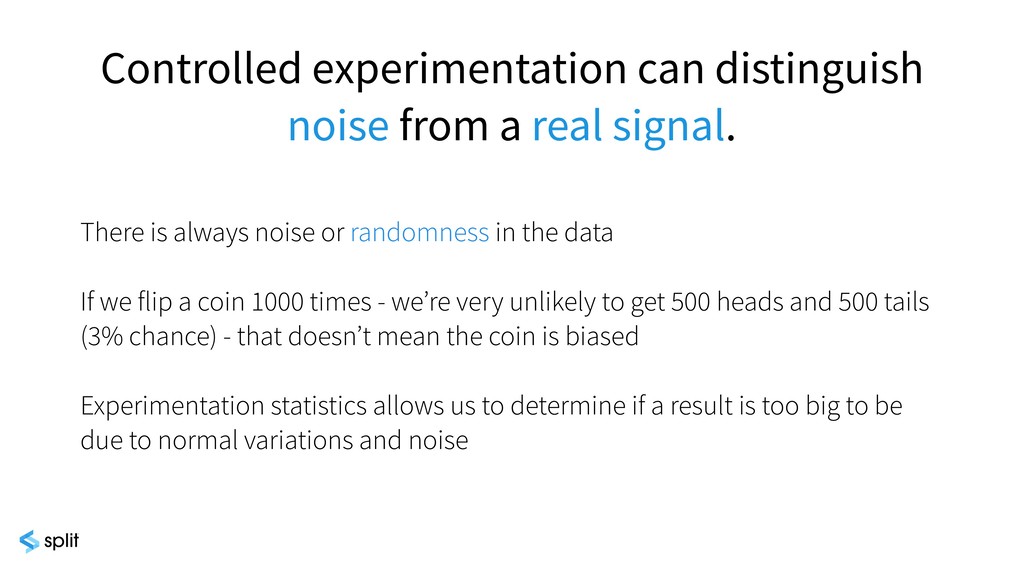
So by using controlled experimentation, and by testing things at the same time and controlling everything else, we're able to make sure that the differences that we see in the metrics really are due to the thing that we actually changed. Another thing which is really important, which experimentation allows us to do, is it allows us to distinguish between noise and a real meaningful signal.
Whenever we're looking at this kind of real data, there will always be noise and randomness. So any customers that come to your site today are going to be slightly different to the customers that will come tomorrow. And to think about noise, imagine you're flipping a coin a bunch of times to test whether it's a trick coin or it's a fair coin.
Well, if you flip it a thousand times, you're unlikely to get exactly five hundred heads and five hundred tails. So just getting a difference in the number of outcomes is not enough for you to say that this coin is biased, that it's not fair.
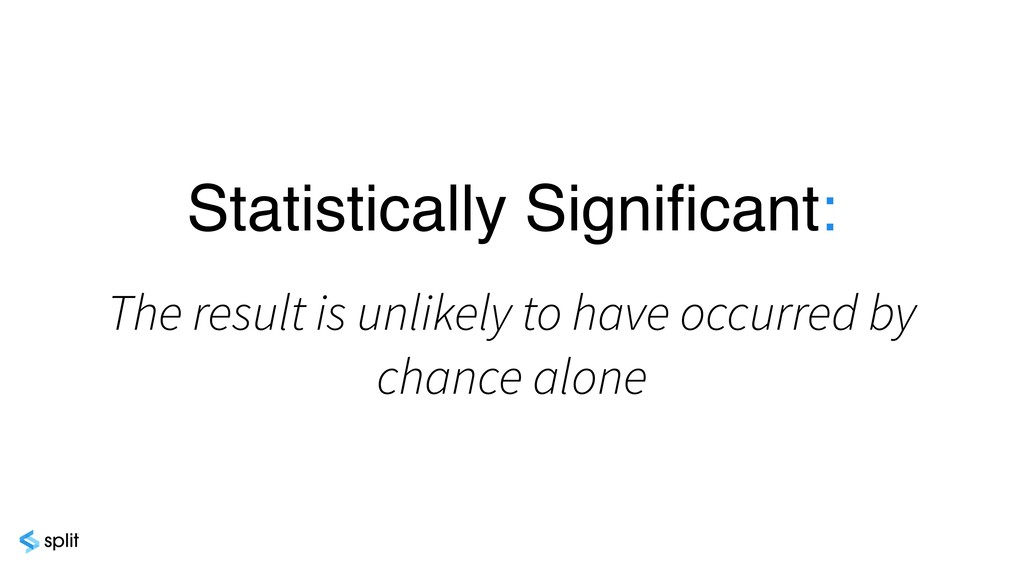
So experimentation statistics allow us to work out difference that needs how big that difference needs to be for it to be indicative of a real difference in the likelihoods. And this is where statistically significant comes in. So it's a term you'll hear a lot in the context of experimentation, and it essentially just means that the results that you got are unlikely to have occurred just due to chance.
So it's a sort of stamp of confidence that the data you're seeing really means that you have detected something meaningful. But because we're dealing probabilities, we can never be certain. There's always going to be a chance that you're drawing the wrong conclusions, unfortunately.
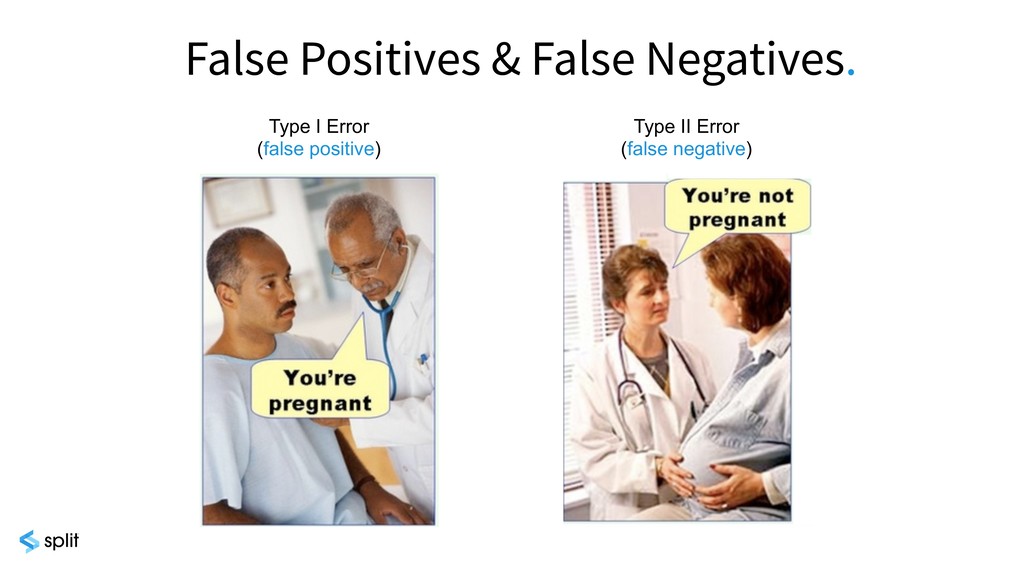
And experimentation allows us to limit and control them. So there are two types of errors in experimentation. There are false positives and false negatives. So false positives are when you think that you've had an impact, you think you've measured something real, but it's actually just noise.
And false negatives are kind of the opposite. It's when you don't think that you've had an impact, but really there was one, you just failed to detect it. So if you forget what they are, can think of this classic meme. A false positive is like this presumably not pregnant man being told by the doctor that he's pregnant, and a false negative is this visibly pregnant woman being told that she is not pregnant.
So I think as product managers, it's easy to believe that our next ideas or things on our roadmap are going to delight our users, move the needle. But in reality, this is rarely the case, and normalizing this reality is a great step to adopting experimentation.
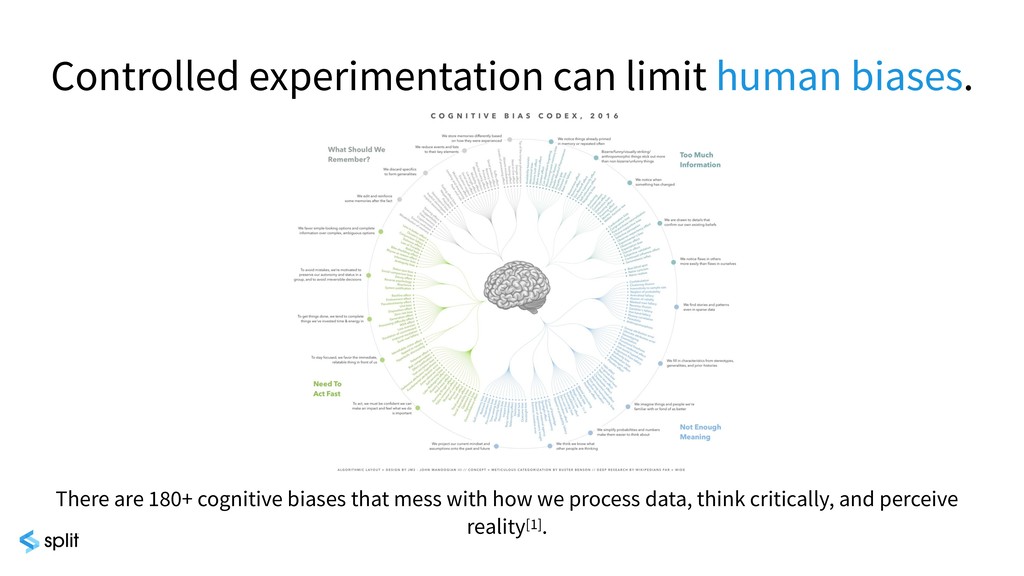
There's actually over one hundred and eighty different cognitive biases that influence how we perceive data, think critically, and ultimately our decision making. You guys might not be able to read this. Well, you might. The screen is actually quite big. But it's just to kind of show the magnitude of the amount of cognitive biases that are working against us every single day.
And as product managers, we're constantly making decisions as well. What to double down on, what to do in our next quarter. And when you start to use measurement with statistics, you gain this whole new level of confidence when you're when you're making your decisions.
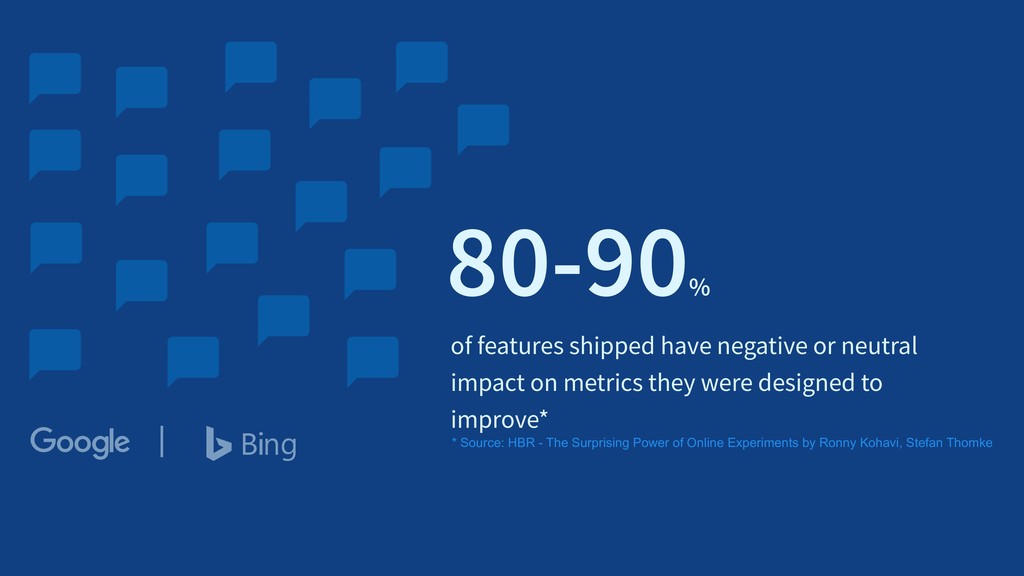
So it's great tool, and I really love Skyscanner's mantra of design like you're right, test like you're wrong. So we're still building our features and products with passion and like an artist, but we're testing these same features and products like a scientist. So Microsoft reported that eighty to ninety percent of features shipped have a negative or neutral impact on the metrics they were designed to improve.
So these numbers might seem a little bit scary, but what we want to emphasize today is experimentation is about learning. If the experiment taught you more about your users, got more confidence in your decision making, and it helped you teach teach you about cause and effect, then the experiment's done exactly what it was designed to do.
So hopefully, we've convinced you that online experimentation is a really powerful tool that you can use in your organization, but we want to make this talk practical as well. So for the next part of the talk, we'll go through an experiment and how to set up one yourself.
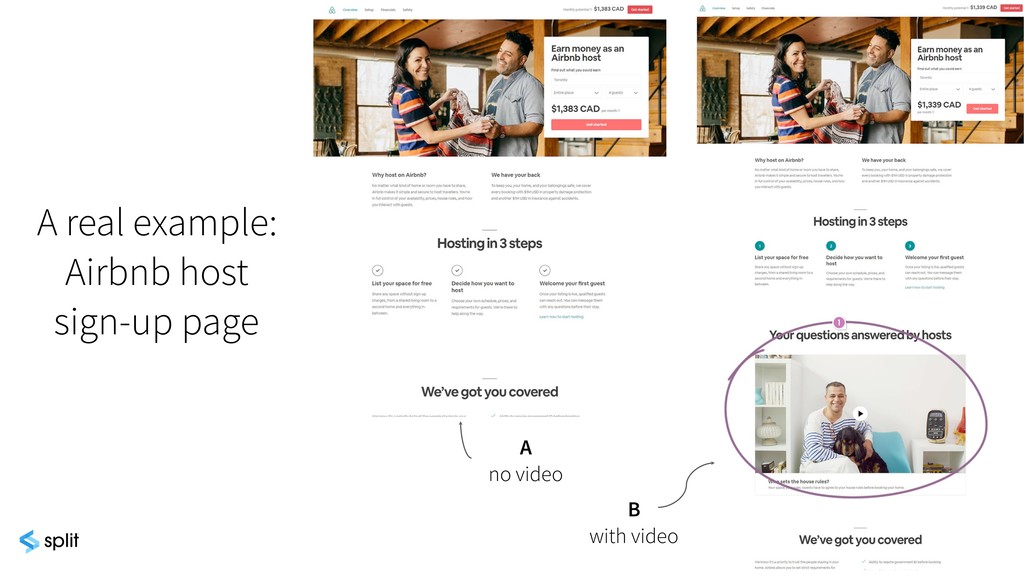
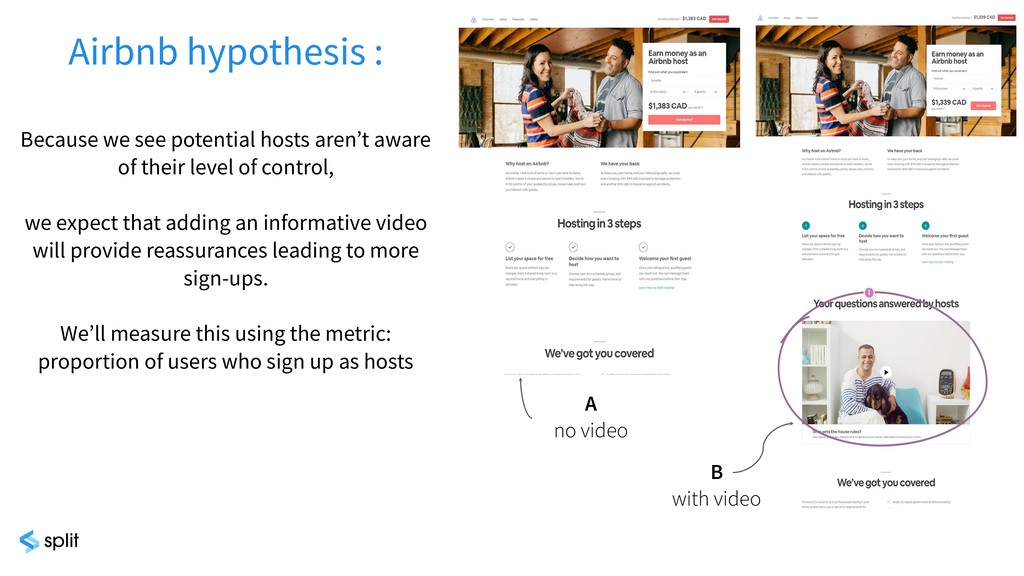
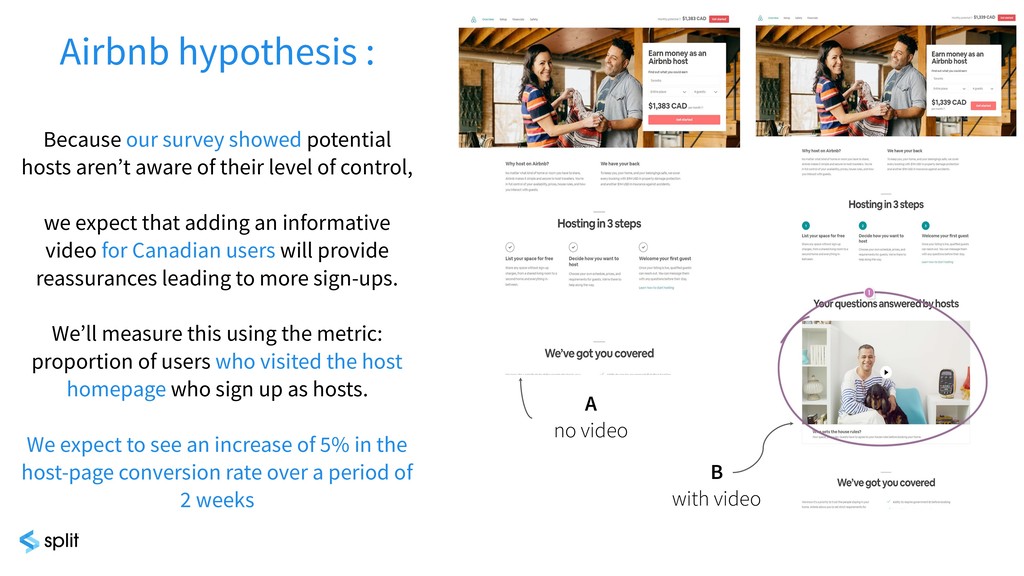
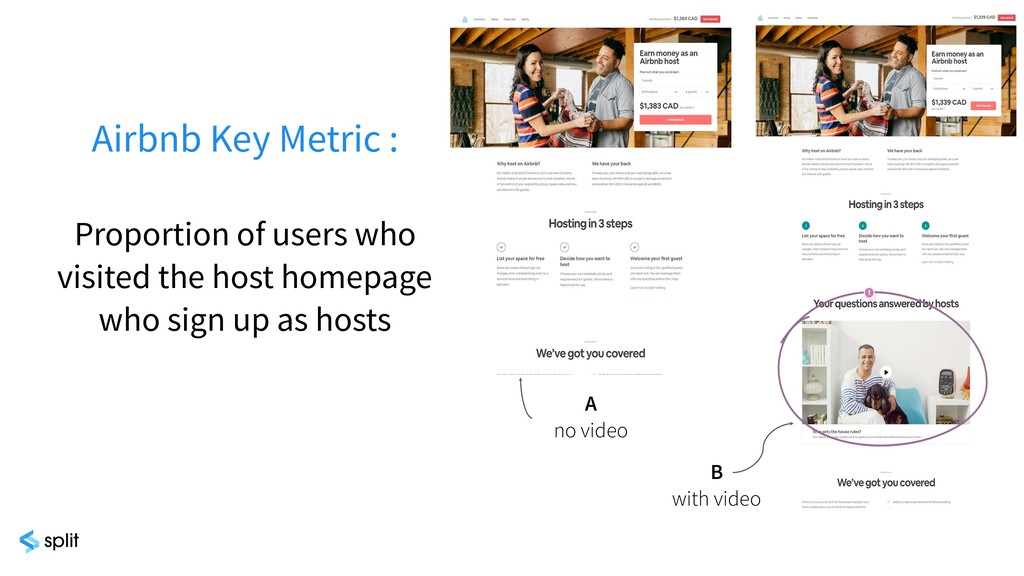
So as I mentioned, there's lots of these different experiments all around us, and this is an experiment run by Airbnb. This is on their host page, there's quite a lot of different information, and what they did for their b variant was transform this information into a video format to see if this made the information more consumable and ultimately drive more hosts in the sign up page.
So the first stage in our experimentation cycle is design. Pretty much working out what you're going to test, how you're going to measure it, and how long to run an experiment for. So hypothesis. So the first step is transforming your ideas into hypotheses.
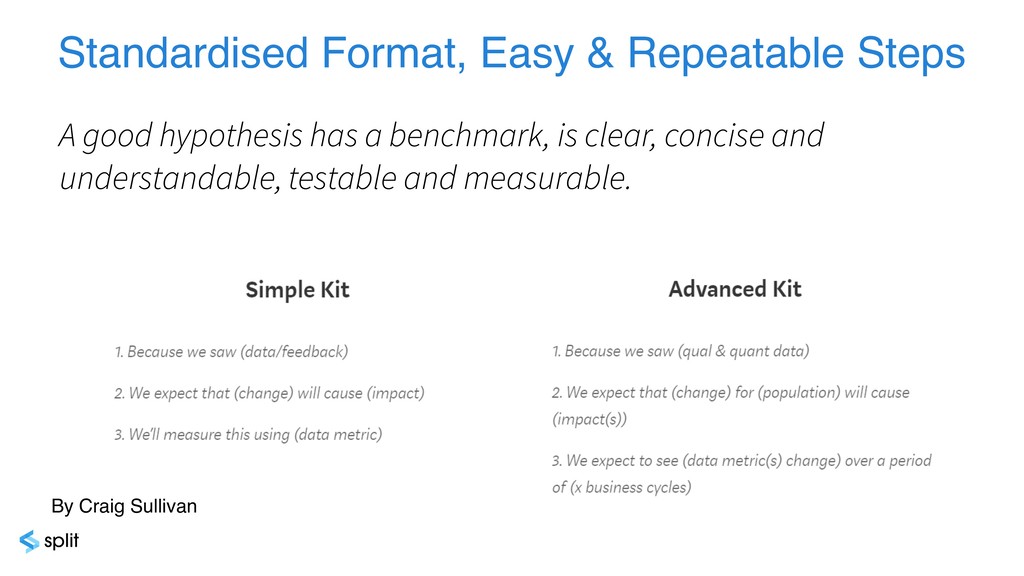
Even better if you can make it easy and repeatable steps, just to really help with that adoption process. A good hypothesis has a benchmark, clear, concise, understandable, and measurable. Here's a couple of frameworks that you can use created by Craig Sullivan. He has a talk tomorrow, so definitely check that out.
But now, Lizzie will go through the Airbnb example using these frameworks. Yeah, so something that you might come up with as a hypothesis for the example of adding the video onto the page could be because we see potential hosts unaware of the level of control, we expect that adding an informative video will provide reassurances, and this will lead to more signups.
And we'll measure this using the metric proportion of users who sign up as hosts. But if you want to make it even better by using the advanced kit, then you could add in reference to particular data which drove that original hypothesis, like referencing a survey here.
And then add in some more specifics, like what's the specific population of users that you'll target, and what is the criteria to be exposed to that experiment? What's the criteria to see the change you're making? Another thing which is really useful to add in is an idea of your expected change to the metric.
So how much do you expect to impact that conversion rate or that metric? And you'll see that that's a really useful thing for the para analysis. So the next part is deciding what metrics you're going to test with, which is a really important part of the experimentation cycle.
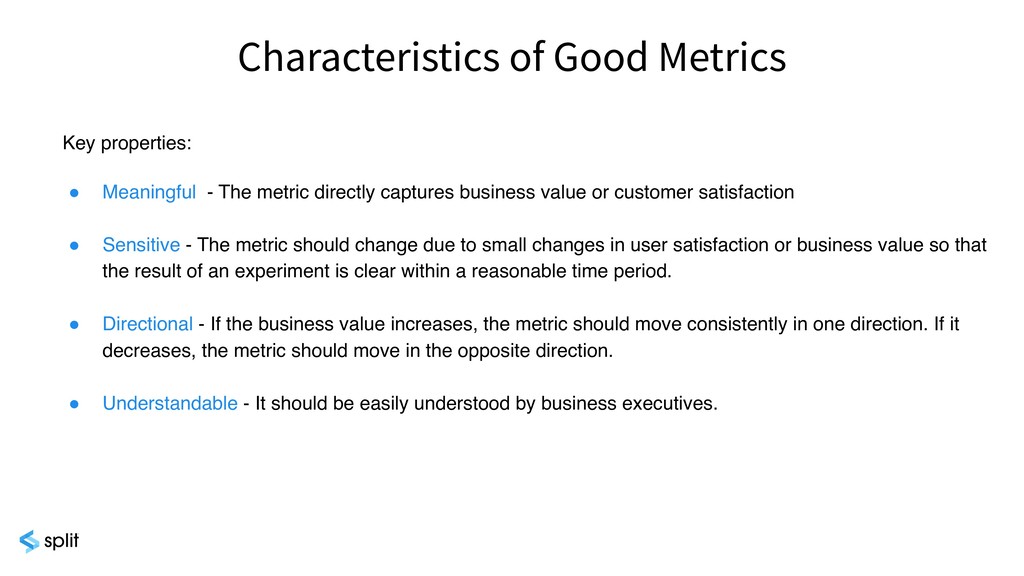
And there's some characteristics to look out for as well. So making sure that these metrics are meaningful, that they tie back to business value and user satisfaction, and I'll show you guys a non meaningful metric in a second. Making sure they're sensitive. So if you have an app or a website where people are just buying things maybe once or twice a year, this metric is probably not sensitive enough to use in an experiment.
It's unlikely that it's going to be influenced by just a two week experiment. And making sure it's directional. So if business value increases, then the metric should move in a consistent direction. Now, some metrics are a little bit trickier than others with this.
For example, engagement with your customer support. If this increases, maybe it means more people are using your products, they've gained a really good relationship with your customer support. But on the flip side, if this metric goes down, it might mean that your product is actually just more intuitive.
So some metrics can be tricky with with when it comes to directional. And then making sure it's understandable. Because it ties back to business value, it should be understood throughout your whole organization, from summer interns right up to your business executives. As promised, here's a non meaningful metric.
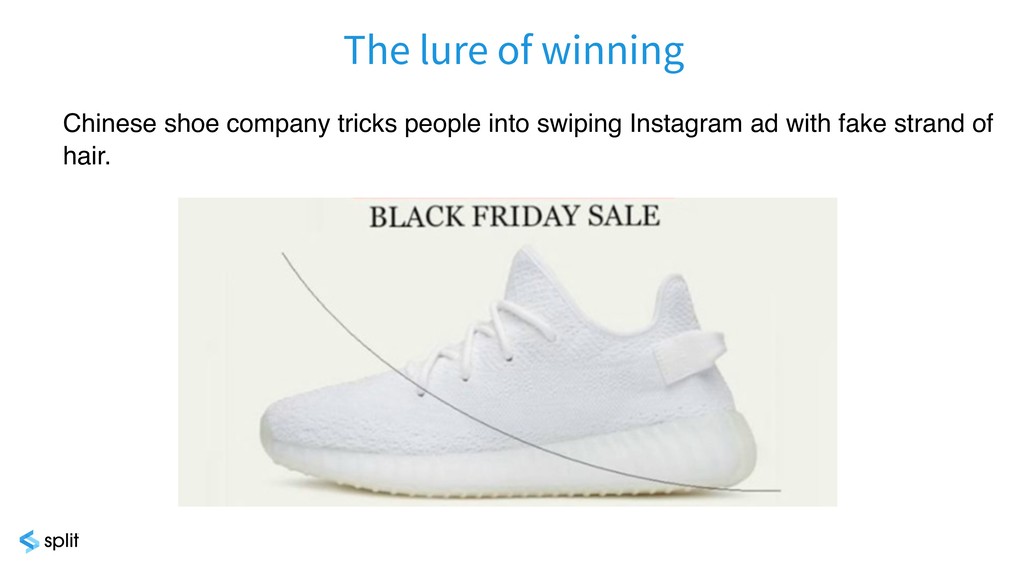
I love that someone did this. A Chinese shoe company tricked people into thinking that there was a hair on their screen. Secretly genius if you want to gamify a metric, but that's not why we're here today. Obviously, swiping on this Instagram ad increased, but it doesn't mean that purchasing increased.
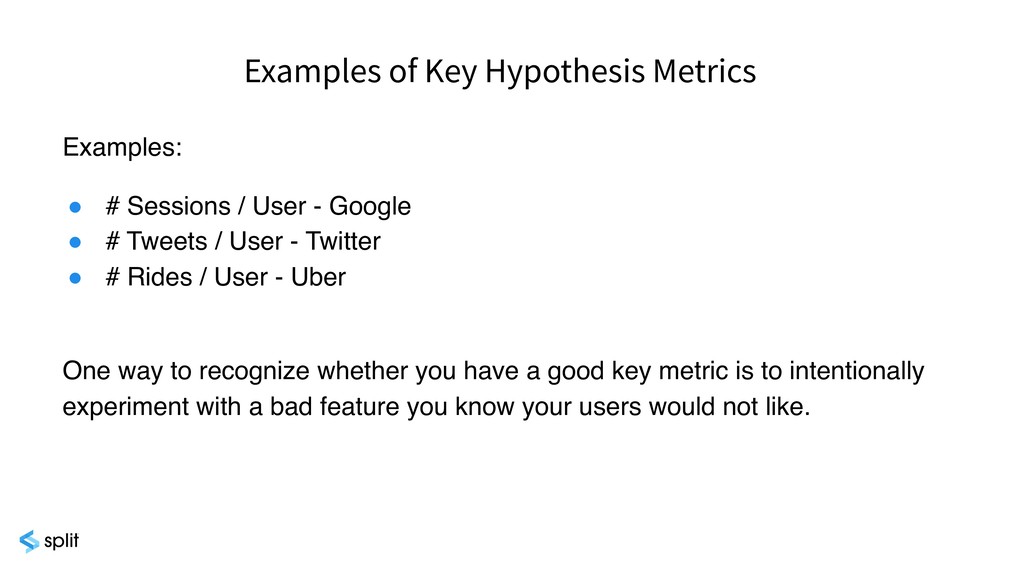
It doesn't mean that they find value in that ad. Hopefully, you remember this example when you're thinking about your metrics and what not to do. So some other some other key examples. So if we think about Uber, rides per user is a really great metric for them.
It indicates that the users find long term satisfaction and business value within the app versus other metrics that they might be measuring, for example, distance per ride or sessions per user. All great things to measure, but doesn't necessarily tie back to long term value.
So one way to recognize whether you have a good key metric is to intentionally experiment with a bad feature you know your users won't like. I'm thinking the product managers in the room at this point are being like, I'm not doing that, and that's fair.
But it's a good hypothetical exercise to go through just to understand your metrics a little bit more. Going back to our Airbnb example, what a key metric for this experiment would be proportion of users who visited this host page and then who actually ended up signing up.
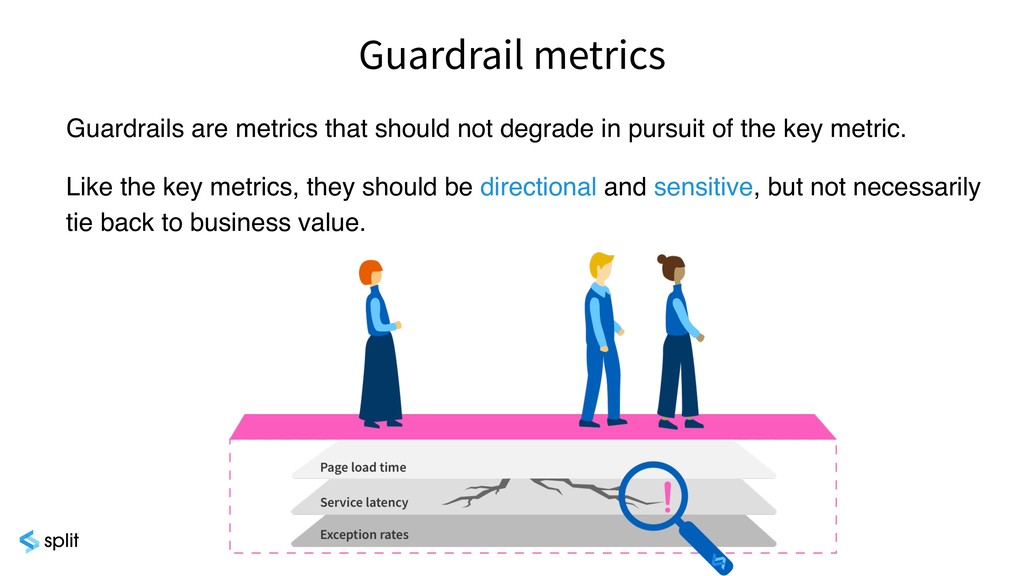
But also beware of measuring just one metric. Obviously, if the key metrics that we talked about increases is a great thing, but you want to look at a whole picture as well, looking at your guardrail metrics. If page load time is increasing at the same time or errors per user is increasing at the same time, this is obviously ultimately bad in the whole picture view.
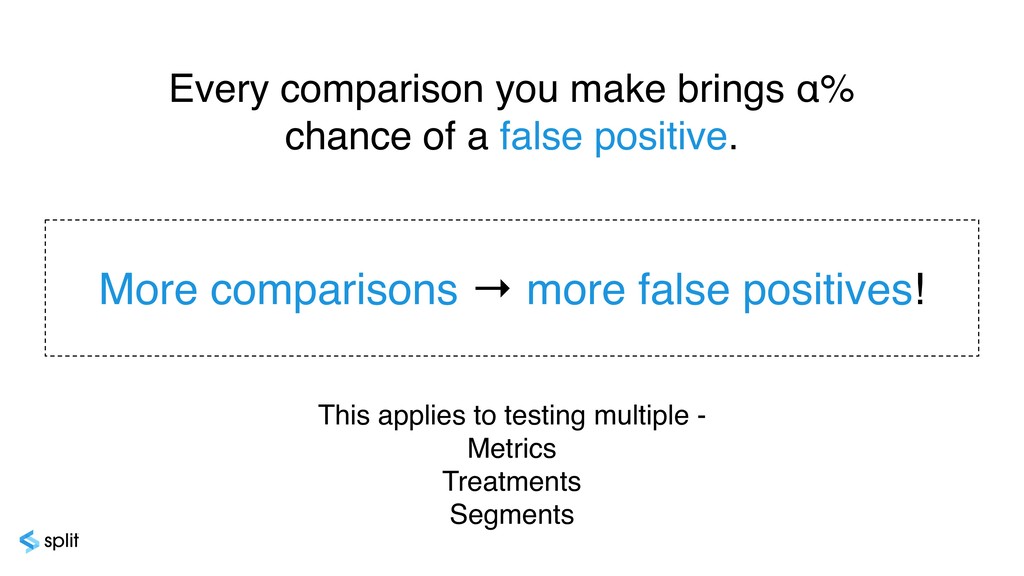
Like key metrics, they're directional and sensitive, but not necessarily tied back to business value. But beware of too many metrics. So we already mentioned false positives and how experimentation allows us to control and limit them, But unfortunately, the way the stats work, it means that every single comparison you make has its own chance of being a false positive.
So naturally, the more comparisons you make, the more chance you have of getting one of those false positives and of being misled by the data. So a comparison can mean testing multiple metrics. It mean testing multiple different versions of your change. It can mean testing different segments of users, so by slicing and dicing people into different groups and looking at how they respond to your change.
These are all comparisons, and the more you do, the more chance you have of getting a false positive result. And it really does add up. So an industry standard confidence level to use is ninety five percent. So what this means is that if you test one thing, you have a five percent chance of getting a false positive.
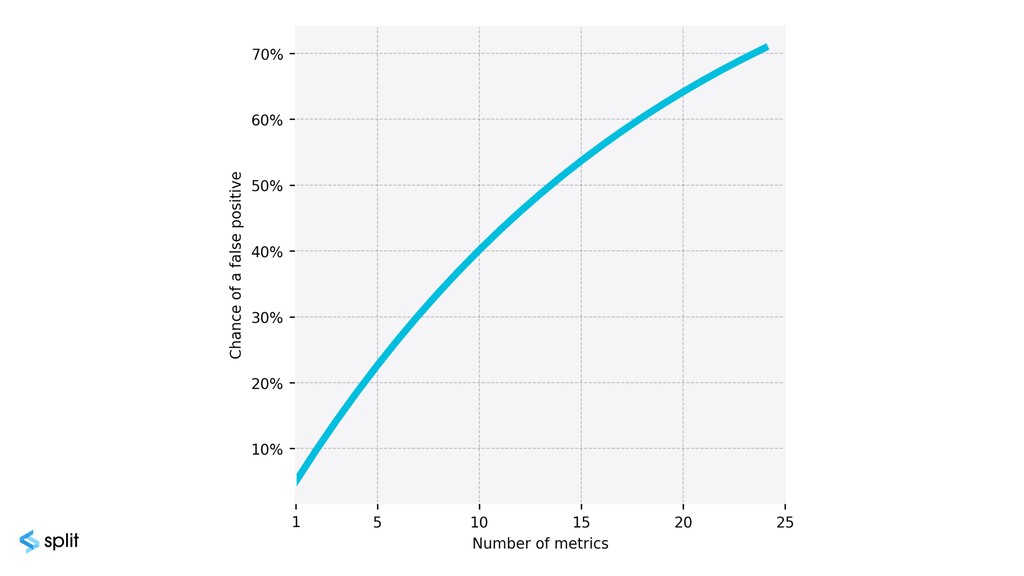
So you have a five percent chance of thinking that something that didn't have an impact did have an impact. But soon as you start testing more things, you'll get such a higher rate of false positives. So you can see here, this plot shows what your real chance of getting at least one false positive would be as soon as you start looking at many things.
So for example, looking at fifteen things gives you over fifty percent chance of a false positive. So what this means is that if every time you run an experiment, you're checking fifteen different metrics, well then half the time you're going to see that something has been significantly impacted, even if what you're testing is absolute rubbish.
So even if nobody cares at all about any of the changes you're making, then half the time it's going to look like people do care. So this can really be making it very hard to draw correct conclusions from your results. It also applies the same way if you look at just one metric, but you look at how people from fifteen different countries responded, it's still fifteen comparisons, and you still have that fifty percent false positive rate.
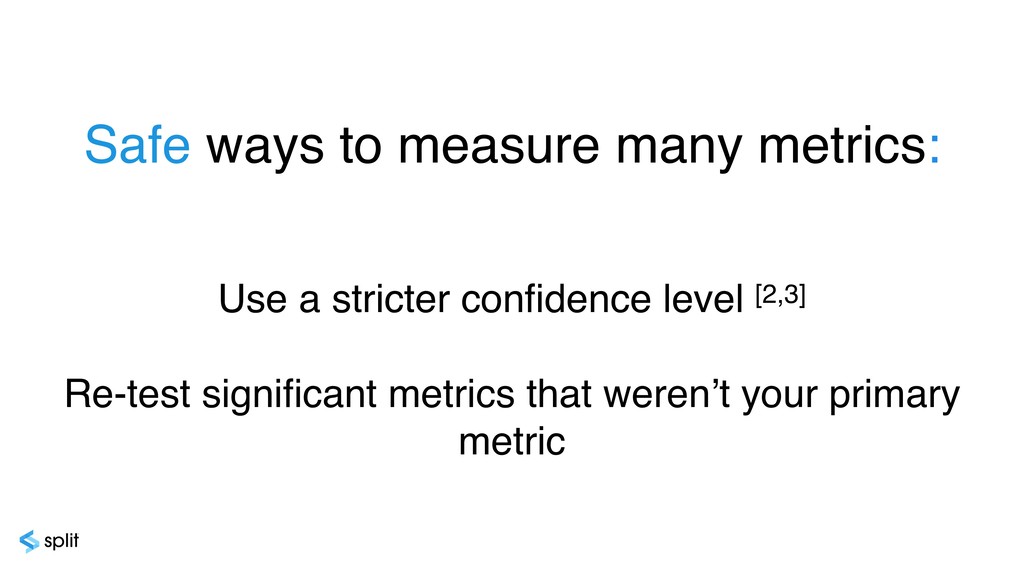
But as Sophie was saying, there are definitely reasons, good practical reasons, why you want to measure many things. Of course, we all want to learn as much as we can every time we experiment. Luckily, there are safe ways to measure many things. Doing this, can be responsibly experimenting and make sure that you keep that false positive rate in check.
We've added some links in the resources slide at the end with a bit more information, but a common approach is to do multiple comparison corrections. So these essentially just use a stricter confidence level, which takes into account how many comparisons you're making. Another approach is just to retest any unexpected outcome.
So anything that wasn't your key metric, if you're not sure if it's a false positive, then run a test again. And then this brings us to the last step of the design phase, which is a power analysis. This is a really essential step, but it's actually often overlooked.
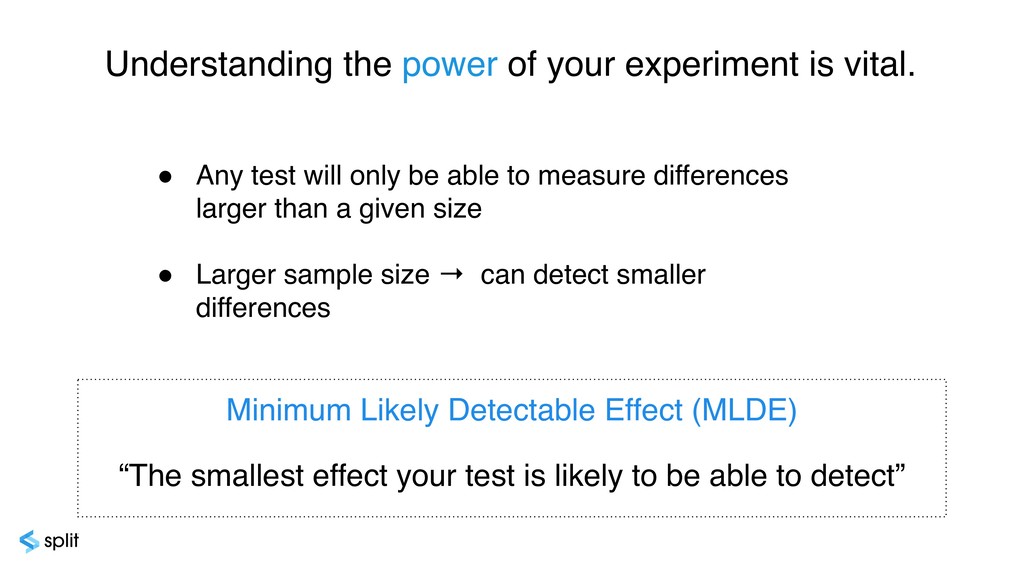
It's all about deciding how long you're going to run that experiment for. The reason why it's so essential is because, unfortunately, experimentation is not magic, and it can't detect everything. So any experiment is only going be able to detect changes larger than a given size.
And any of those smaller changes are just not going to be distinguishable next to all the noise in the data. So each experiment and each metric in each experiment will have a minimum detectable effect. And it's really important that this minimum detectable effect is smaller than the size of changes that you care about and that you expect to make.
So if you imagine that you expect to change your conversion rate by five percent, but the design of your experiment means that you're not going to measure anything that is smaller than, say, ten percent. If you run this experiment, you're kind of wasting your time because you're very unlikely to ever be able to detect the kind of changes that you're expecting.
So you need to either redesign the experiment or start testing bigger, more drastic changes. The main lever that you can pull to change the power of your experiment is sample size. To increase the sample size, which usually means running that experiment for longer, means that you can detect those smaller changes.
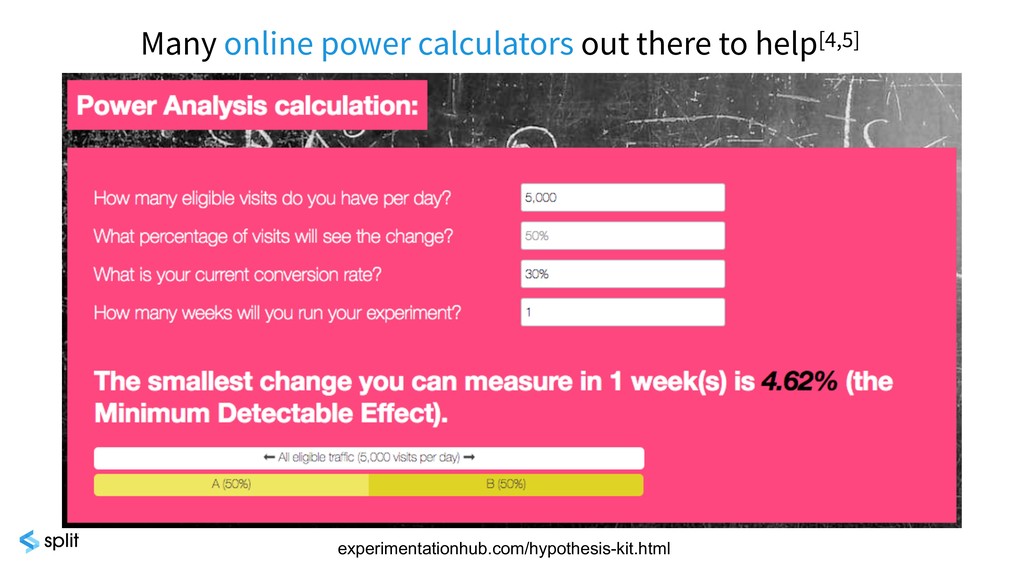
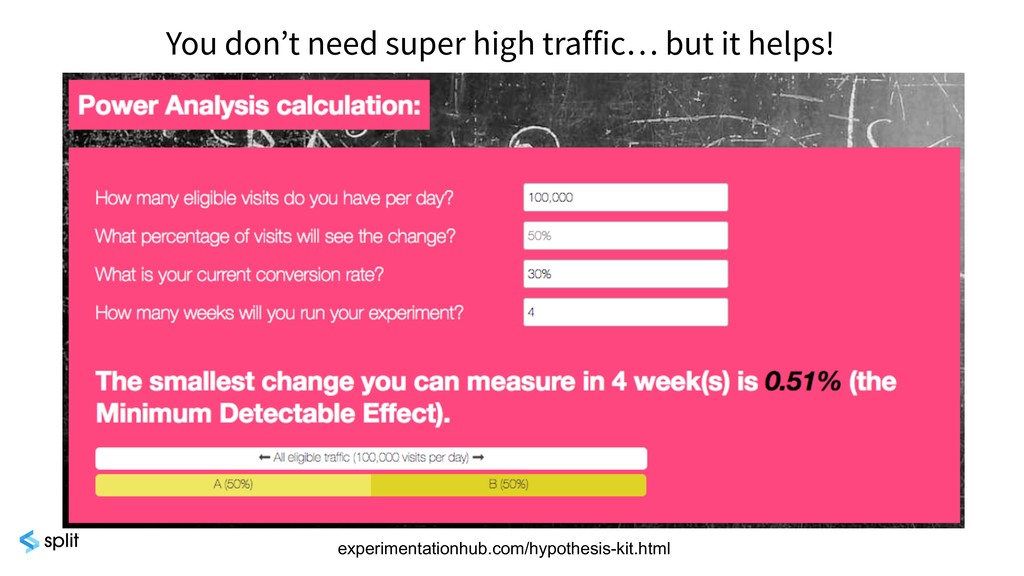
The good news is there are a bunch of online calculators out there that can make this math really easy. I've screenshotted one here, which I like from experimentationhub dot com, which is run by an ex colleague of ours, Rick Hayam, who is somewhere around in the conference.
But to use this kind of calculator, all you need to know is the expected traffic and then the current conversion rate. So, let's imagine that we want to decide how long we need to run that Airbnb example experiment. These are made up numbers, but let's say that you have five thousand people visiting that host sign up page every day, and the current conversion rate on that page is thirty percent.
You just put them into a calculator like this, and it will tell you that if you run this experiment for one week, you can measure any changes which are going to be bigger than about four point six percent. But maybe this number is too big, and maybe you expect to have only a few percent impact to your sign up rate.
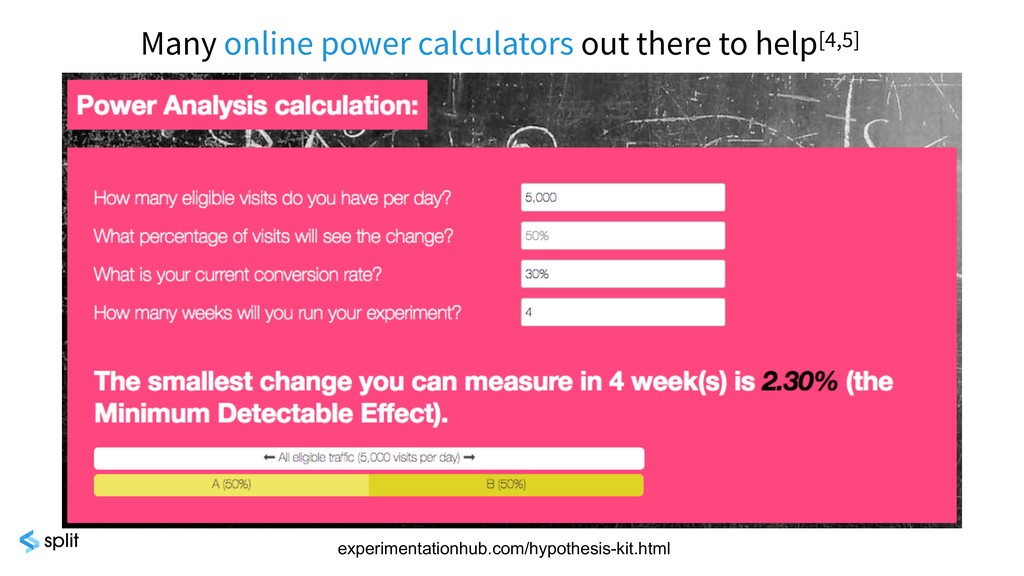
Well, then you need to run it for longer. So if you change that to four weeks, you can then see that you have much more sensitivity and you can detect changes about two point three percent. And also contrary to common belief, you don't need a huge amount of traffic experiment.
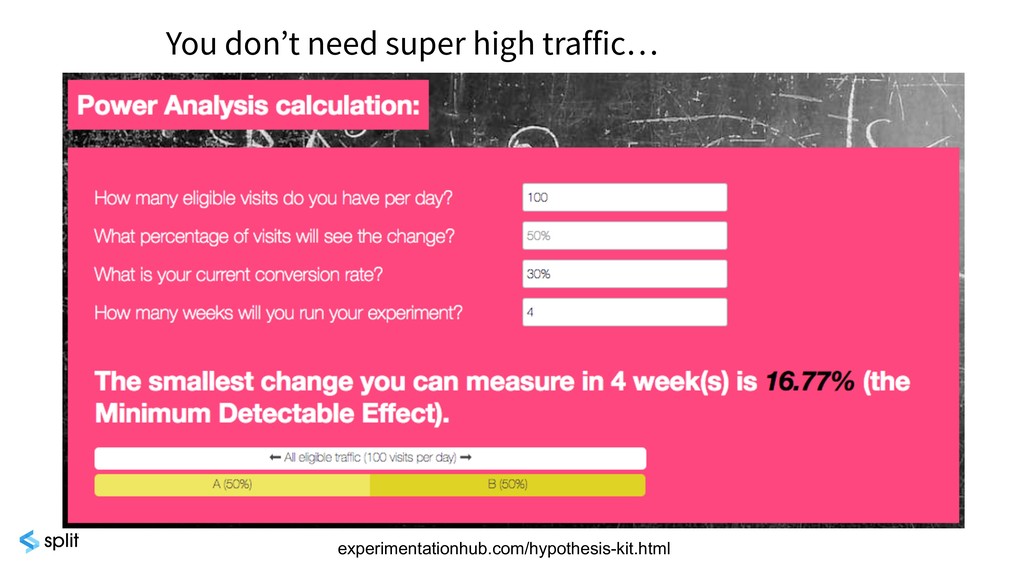
So you can still get valid and useful results out of experimentation, even if you only have a very low traffic. So you can see for just one hundred users a day, you can still run a valuable experiment. You just can't measure those small changes.
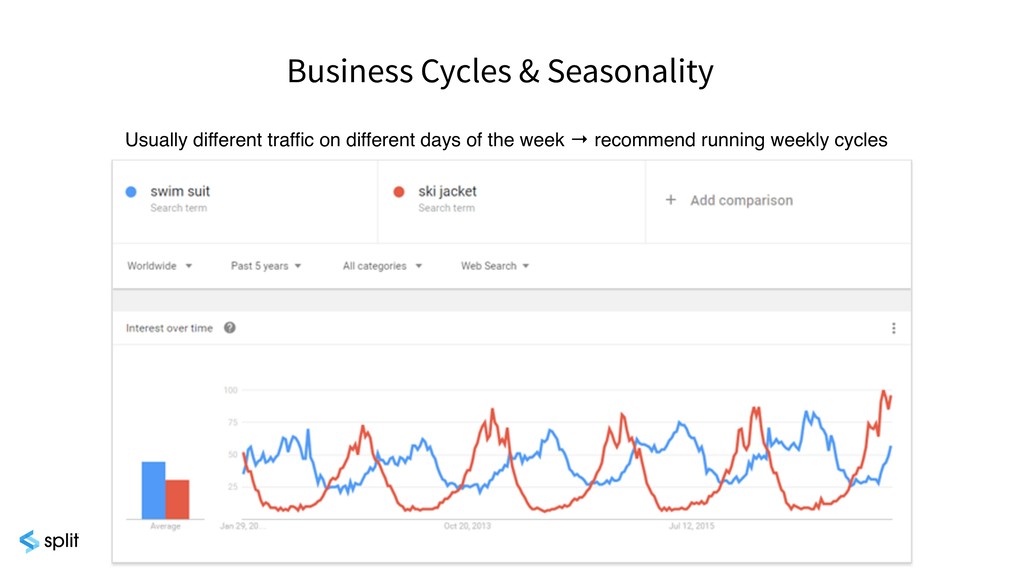
On the other hand, having a hundred thousand users a day, you have loads of power, and you can measure sub percent impacts. As product managers, we know that interactions with our product changes throughout the week, throughout the month. If you're a travel site, for example, you might see a spike in traffic on Mondays when people are searching for flights, searching for hotels to kinda shake those Monday blues.
But if we were to run an experiment just for a few days, not including a Monday, then we'd be missing out in capturing a lot of that purchasing and searching behavior, and therefore biasing the experiment. So it's really important to understand your own business cycles.
They're usually a week, but it could be less, could be more, so it's worth digging into the data. It's good to call out as well that this also may differ between your mobile and desktop users as well. Once you understand these business cycles, you can combine them with the power analysis and start to think about how long you need to run an experiment for in multiples of those business cycles.
The next stage is execution in our experimentation cycle. And first things first is we need to ensure that whatever variant a user sees is completely randomized in an unbiased way. And then making sure whatever user, whatever user ID, whatever we're randomizing on, that we can tie that user ID back to a variant that they saw, and then what actions they took as a result of this.
So there's a lot of tools out there that help you do this, kind of depending on the use case. Split software, for example, is really targeted at engineers and product managers experimenting across their full stack. But as I said, there's lots of tools just kind of depending on what you're looking for.
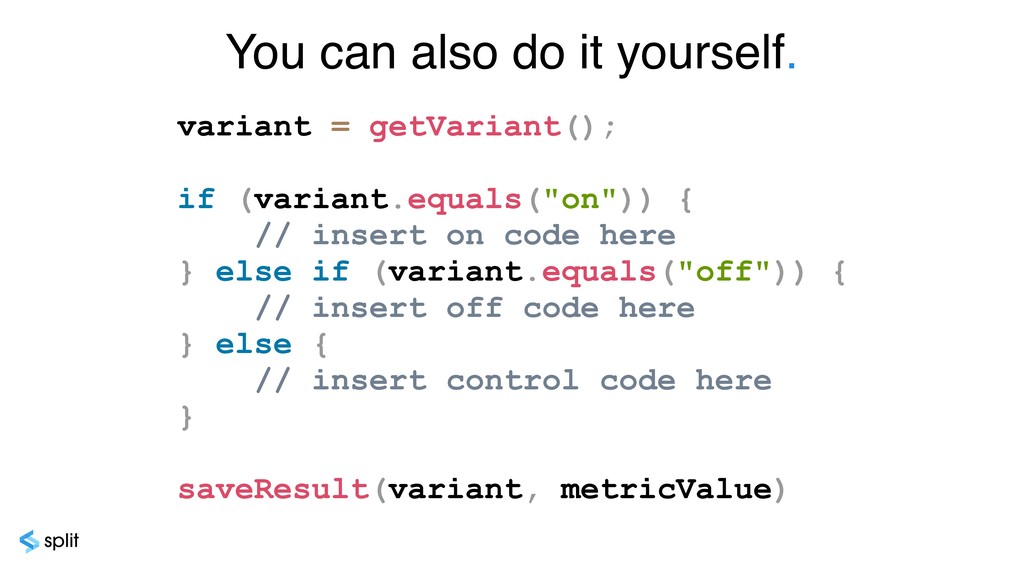
But while these tools definitely make it easier, you can actually just go away and do it yourself. So at high level, it's pretty simple. So all you would need is a basic randomization function. So something like we've called getVariant here. It would just take in an ID, like a user ID, a session ID, a cookie, and then it will randomly pick one of your variants.
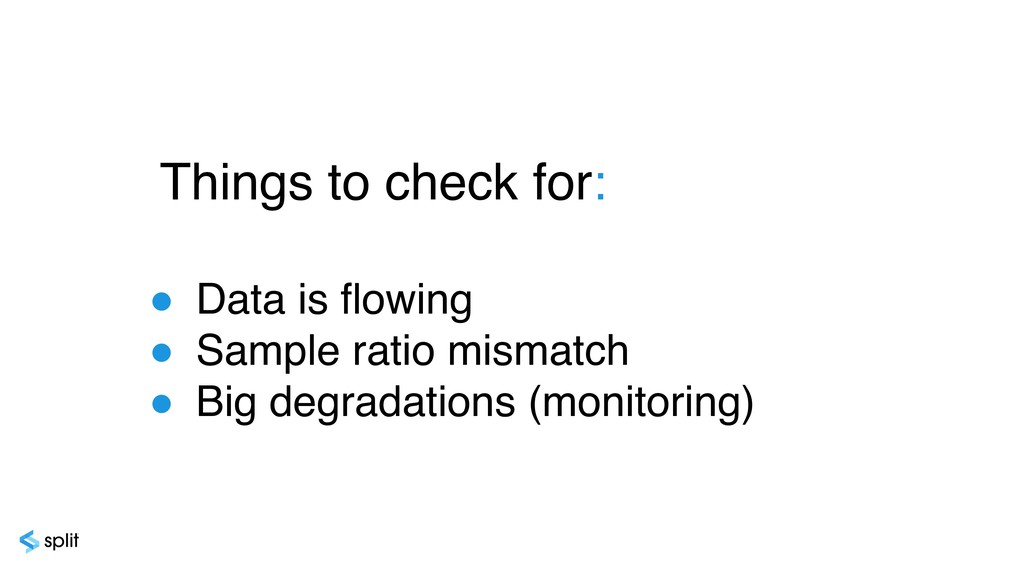
You just serve that variant, maybe with an if else statement, and then you just need to make sure you track which variant was served along with the rest of your data so you can aggregate later. So things to check for when you're running your experiment.
So making sure your data is flowing. So that data collection that we talked about a second ago, making sure that's happening throughout your whole experiment. A sample ratio mismatch, so making sure your traffic is being split fiftyfifty within a reasonable margin. It might be forty nine point five and fifty point five, just depending on the levels of the traffic you're seeing, but making sure it's in a reasonable margin.
And then big degradations. So if you find that you set up your experiment and your page has just stopped working, the errors per user has gone through the roof, stop your experiment and start again. Don't feel like you have to run or wait for a full business cycle to correct this.
Start again if this happens. But don't peak. By all means, check those things that Sophie mentioned. If something has gone really wrong, then stop your experiment fine. You can't just stop your experiment at any point and conclude your results as you normally would.
So this is peaking, which is a colloquial term for continuously monitoring experiments. So checking those results regularly and stopping it when you see something you like or you see significant results. This is another one of those common pitfalls that we see people do, and it's actually really dangerous behavior that can lead to a much higher chance of getting a false positive.
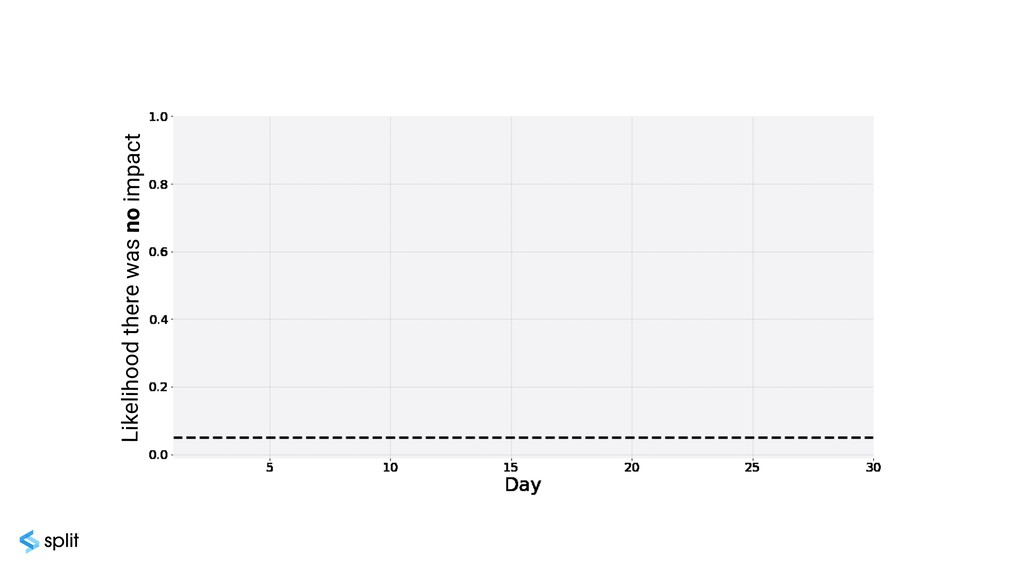
The reason why it's dangerous to do is because your results are just naturally going to fluctuate up and down across the course of an experiment just due to noise. So this GIF shows daily results for a thirty day, completely unimpactful experiment. But if you were to check it every day, even though there's no true impact, you're still going to see different results every day.
The problem with peaking is that the more times that you check the results, the more chance you have of just happening upon a day when the noise looks like an impact. So essentially, the more looks you do, the more chance you're giving the data to fool you.
So it's really important that you do that paranalysis at the beginning, and then you stick to it. Don't be tempted to stop an experiment just because you've seen something you like or because you think that you've reached significance early. That's not how it works.
Then once you've got to that predetermined time and you've stopped that experiment, then you reach the analysis phase. So it's the last step of the experimentation cycle. So here, you need to do some statistics, draw your conclusions, and then decide what actions to take.
And people are often instantly put off whenever I say statistics. But again, it actually does not need to be that scary at all, because there are a bunch of online calculators which can just do it all for you. So what you need to get to is a p value.
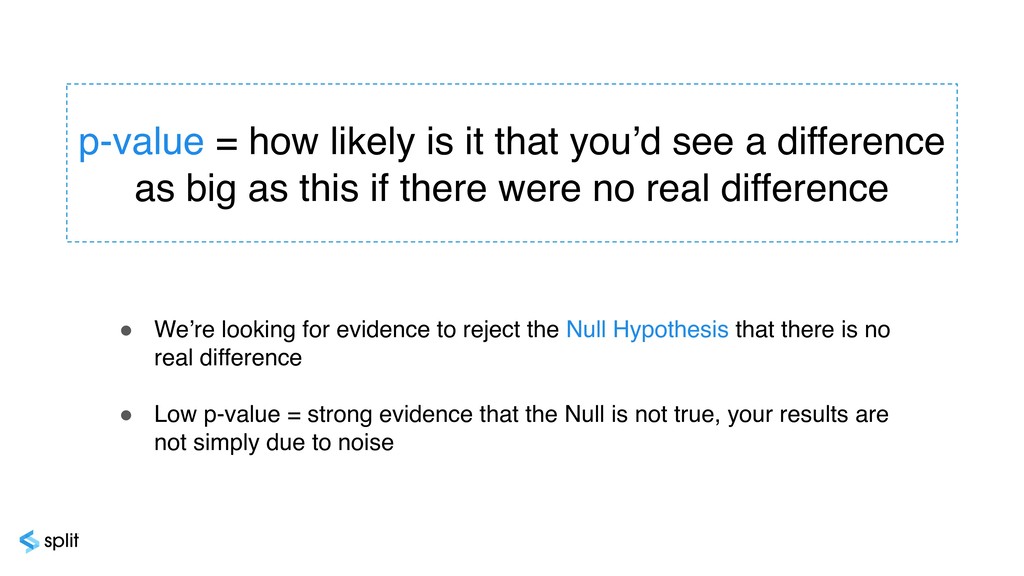
And a p value is probably the most important statistical concept in experimentation, so I'll take a minute just to try and explain what it is. A p value is just the probability that you would have seen results that you just saw just due to noise.
So if there was no true impact there, you hadn't really changed behavior at all, the p value is telling you how likely it is that the metric would look like it does anyway. Because when we're experimenting, what we're actually doing is looking for evidence to reject the null hypothesis.
And the null hypothesis is this idea, this kind of statement, that you didn't make any real impact at all. And then the lower the p value, basically the more the data is saying this is a really unlikely thing to see if that null were true.
So a low p value means it's a really unlikely result if you didn't have an impact. And then it's giving you a lot of evidence to reject the null and to be pretty confident that you really did change behavior. People usually use, as I said, ninety five percent confidence, which means that a p value threshold of zero point zero five is about standard.
Then if you get a p value less than zero point zero five, you can say it's statistically significant. As I said, there are a bunch of online calculators. Again, we put some links in the resources slide for some ones that we like, but let's look at how this might work with that example Airbnb experiment.
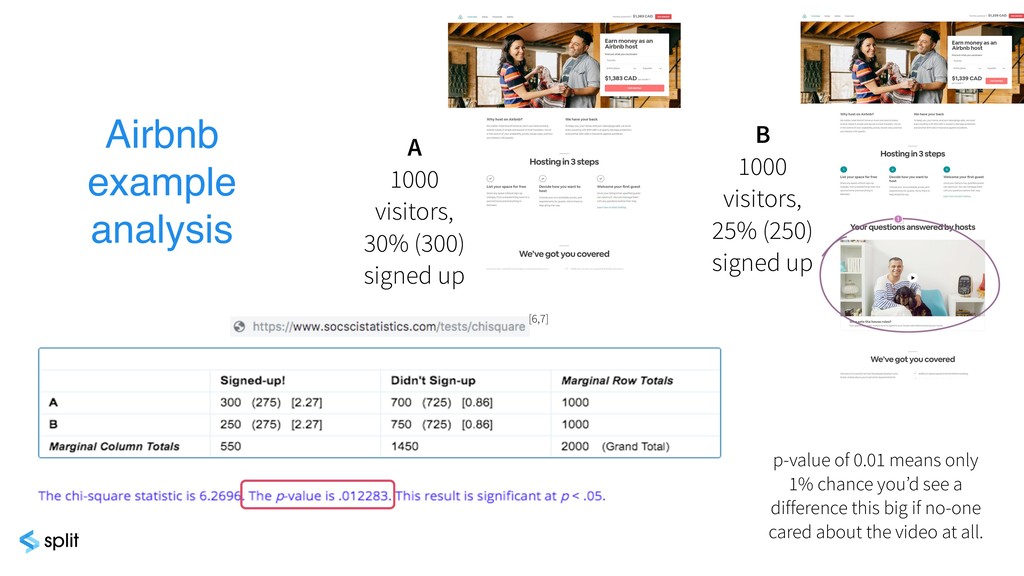
Counterintuitively, it actually was not successful. We don't have real numbers. Again, these are made up. But let's say that one thousand users visited each version of that host signup page, and then thirty percent signed up in the A version, but only twenty five percent signed up in the B version where we added the video.
Well, we need to get to a P value so that we can work out whether this was actually indicative of a real thing, if we really did decrease the chances of people signing up, or whether it could just be due to noise. If you put these particular numbers into an online calculator, you'll see that it corresponds to a p value of zero point zero one.
So remember, what this number is telling us is that there's only one percent chance that we would have seen at least a five percent decrease in this conversion rate just due to noise. So because one percent is really unlikely, then it means we can be pretty confident that we actually really did impact behavior.
So we really did decrease the chances of people signing up by adding this video. And this means that if you were to go ahead and make this change, you'd probably see this decrease repeated. So just to go through some other experiment results and what actions you can take.
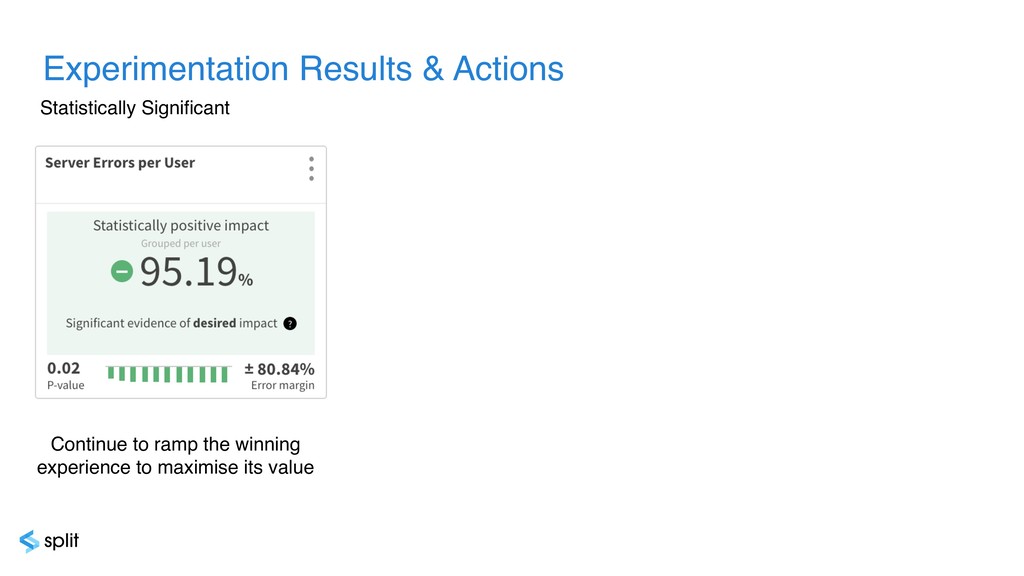
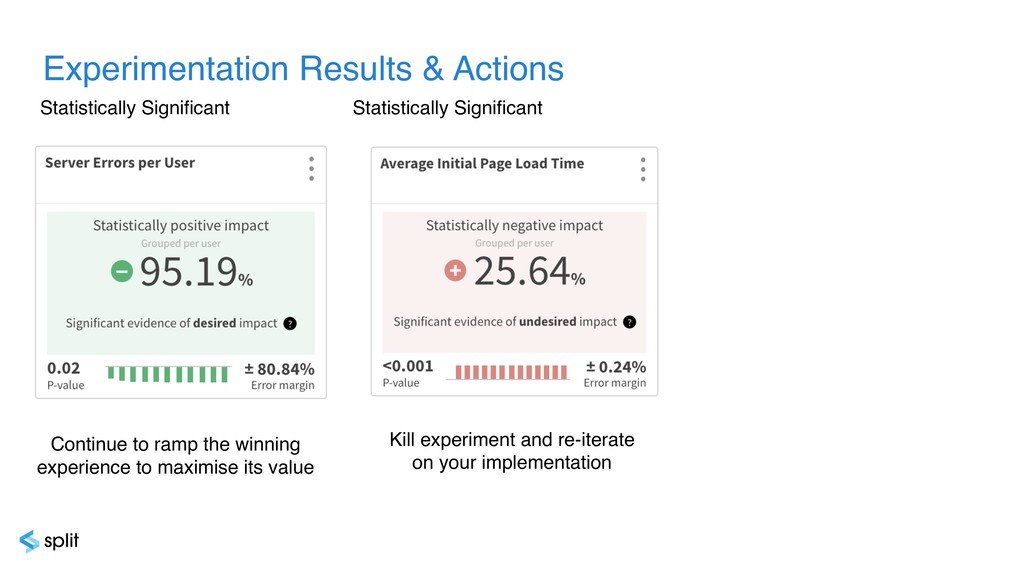
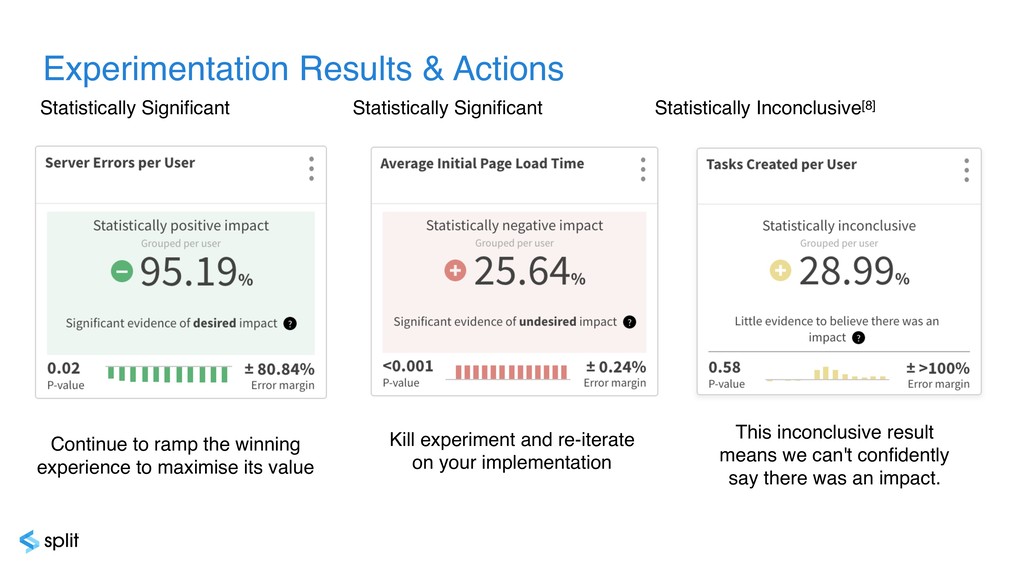
So if you were able to achieve statistically significant results in the desired direction of your metric, and you're running this experiment fiftyfifty, obviously you want to ramp this up to one hundred percent of users to really maximize the value of this variant. But also think about other ways you can scale.
Perhaps you're running this experiment just in one market that you operate in. Think about what other markets could benefit from this variant and run another experiment, and this goes for other parts of your application as well. Perhaps you designed a new workflow, a new call to action.
What other parts of your app could benefit from this variant? Again, run another test and see if you get statistically significant results again. If you were able to achieve statistically significant results in the undesired direction of your metric, obviously, you want to kill this experiment at the designated time to minimize impact, but you can be confident when you're pivoting away from this variant.
When you're thinking about your new ideas, you can pivot away from this idea. And then statistically inconclusive results. Now remember, this means that we can't be confident that there was or wasn't an impact, but this is normal. But what you can do with statistically inconclusive results is dig into the data and see if it impacted specific user segments or not.
For example, your variant might have impacted Chrome users versus Firefox users. If this is the case, run the experiment again just on Chrome users. You might get statistically significant results that way. You can also understand the minimum and maximum metric value. You can be confident where that range lies, and you can do that through error margins and confidence intervals.
We've added a link in the resources slide as well to help you interpret confidence intervals, but that's also a really powerful tool in itself. But whatever results you get, the really important thing is to remember to share your learnings with your teammates, with your colleagues, and share the learning as much as possible, because that's going to really help you adopt an experimentation mindset in your organization.
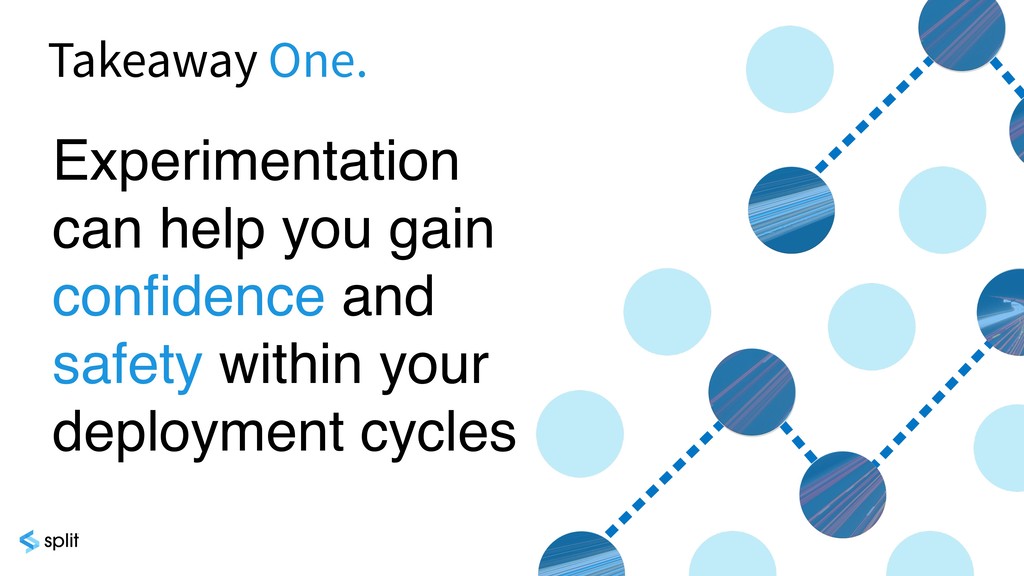
But this is the end of the experimentation cycle, so hopefully you got excited about experimentation, and you feel like you can try an experiment in your own organization. But some takeaways from today. Takeaway one, experimentation can help you gain confidence and safety within your deployment cycles.
Takeaway two, experimentation allows you to understand your product and your users in a new way. Takeaway three, It's really valuable to know what you're testing up front, and worth it to invest time in choosing the right metrics. And then the final takeaway, takeaway four: I think this is a really important thing that we really want to get across.
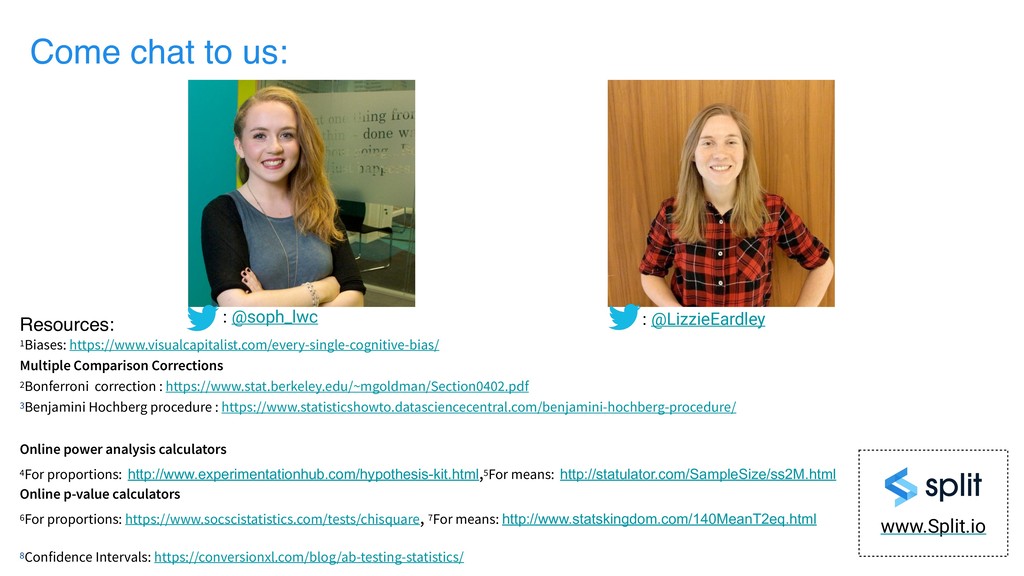
Any well designed, implemented, analyzed experiment is already a successful experiment, Experimentation is all about learnings. So don't aim for significance, aim for learnings. That's us. We're about today for the Q and A afterwards, and we're about tomorrow, so definitely come to chat us, or you can catch us on Twitter.