When a consumer opens the Deliveroo app they have the option to pick from a huge variety of restaurants. Depending on their location, the number of available restaurants can vary from 10’s to almost 1,000 (and counting.) However, as there is limited screen space on a consumer’s device we want to make sure that the restaurants that we surface first are the most relevant.
In October last year, we formed a team to address this problem. We needed to decide on the tools and infrastructure to build and deploy these models as well as how we were going to frame the ranking problem.
In this talk, we’ll explain how we’re using Tensorflow to train and deploy our models. We’ll also discuss the challenges that we’ve faced in tackling the ranking problem and outline the solutions that we’ve implemented or proposed to overcome them.
1 / 44 Use ← → to navigate
Auto-generated transcript - may contain errors.
Tap a timestamp to jump the video.
Hey, everyone. Yeah. I'm Johnny, elephant in the room. It says thirteenth of of July over there. I've given this talk before. But, yeah, for those who weren't at Pi Data London, it's hopefully new for you. Yeah. So I'm Johnny. I work in the merchandise and algorithms team, Deliveroo.
And we're interested in in trying to solve the problem of basically trying to give the best consumer experience in the app. And I'm gonna talk about one of these problems about ranking the restaurant list. So kinda get a quick show of hands. Who does not build predictive models using machine learning?
Who does not do that? Okay. Sweet. So now I know where to pitch this. Great. Okay. So what I'll first do, I want to give a brief introduction for those that don't know what deliver is. And then I want to take some time talking about our approach to ranking.
How we actually frame this problem in a machine learning way that we can actually solve. And then I wanna talk a bit about the the tools that we use. And then finally, we've done quite a few of these things. We've we've we've productionized a bunch of models, run a lot of tests, and we've made a lot of mistakes along the way.
And so hopefully, I'll I'll I'll give some lessons learned which you can all take with you on on any project, not necessarily ones to do a machine learning, but some lessons that that we've learned there. Okay. So delivery. I've met quite a few people from the US, already here.
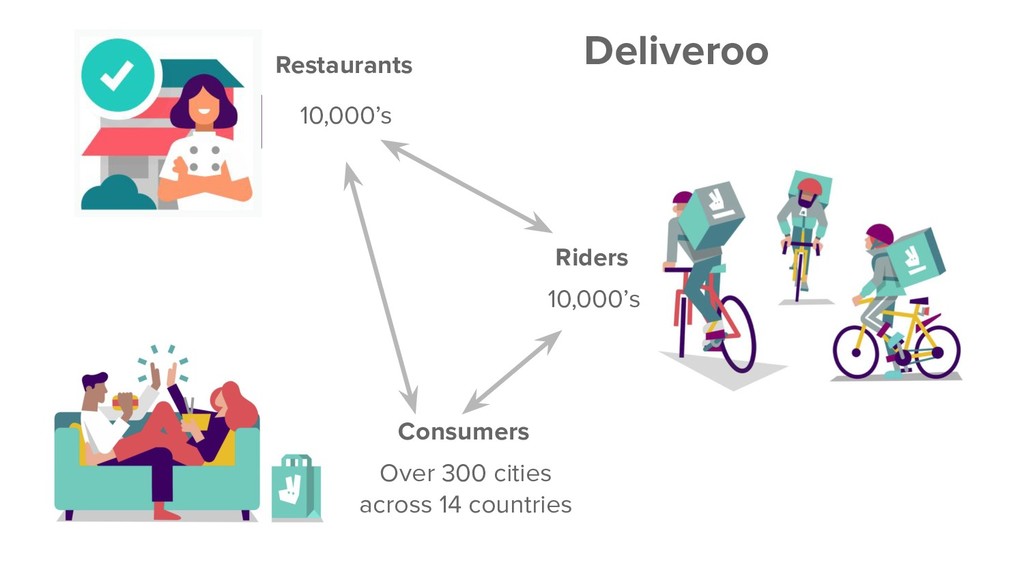
And so for those from the US, we're basically DoorDash, but in the UK. And for those that who still don't understand, basically, we're a platform that tries to connect consumers with restaurants. Right? That's what we try and do. So there's an app, you open the app and you have a list of restaurants and you can say, oh, I'm gonna pick this, pick a restaurant, that I want to order from and Deliveroo has a fleet of riders and those riders, they'll what they'll pick one, go to that restaurant,
pick up your order and deliver it to your door. And that's the plan. So we have a three sided marketplace. We've got tens of thousands of restaurants, loads of riders and also lots of consumers and we operate in in thirteen different countries. It was fourteen. It's changed now. Thirteen.
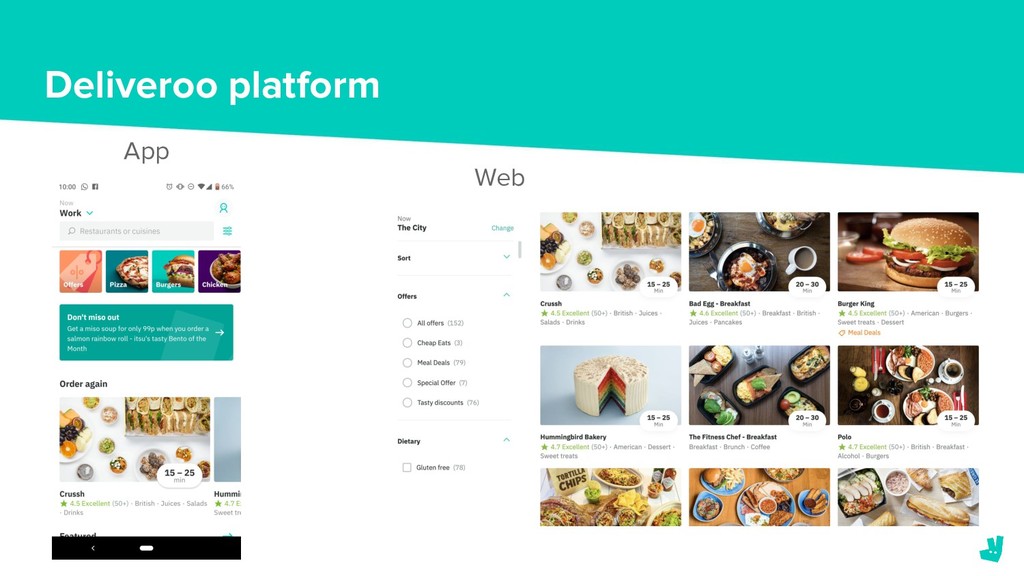
Yeah. So, yeah. It's changed since I last delivered this. Okay. So if you open the deliver app, this is probably what you see. And essentially, it's a list of restaurants. Right? That's what you'll see. And our hypothesis is that if we can show you more relevant restaurants, restaurants that you prefer, you're more likely to purchase and you have a better experience.
So the merchandise and algorithms team is trying to solve that problem. We want to show you the most relevant restaurants as you open the app. That's the plan. So that's that's the introduction. That's what deliver is. That's what my team does and that's that's the goal we're trying to solve.
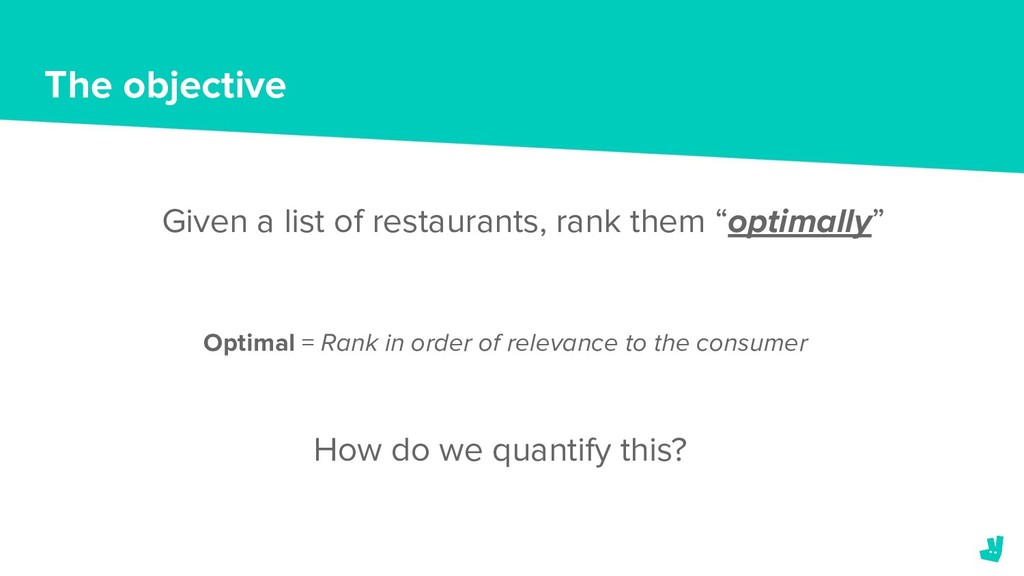
So now I wanna spend the next part of talk talking about how we put that problem into something that we can solve with with machine learning, data science. Alright. So, just to restate the objective, given a list of restaurants, can we rank them optimally?
And optimally could be I mean different things. There could be different things that are optimal depending on the objectives of the business at that point in time. We've decided to say optimal is relevance. Right? Optimal is relevance. But I'm a data scientist. I'm a mathematical guy. I like numbers. Right?
Up until now, it's a bit wishy washy. So how can we quantify this? How can I measure whether we are actually providing more relevant restaurants to customers? And so we have these thing called online metrics and I'll discuss later on the difference between this and offline.
But what I want you to to, at least take away from here is an online metric is something that you can measure when you're actually putting a feature in front of users. So this is when we've actually released the feature, we've released an algorithm and users are actually using our our platforms.
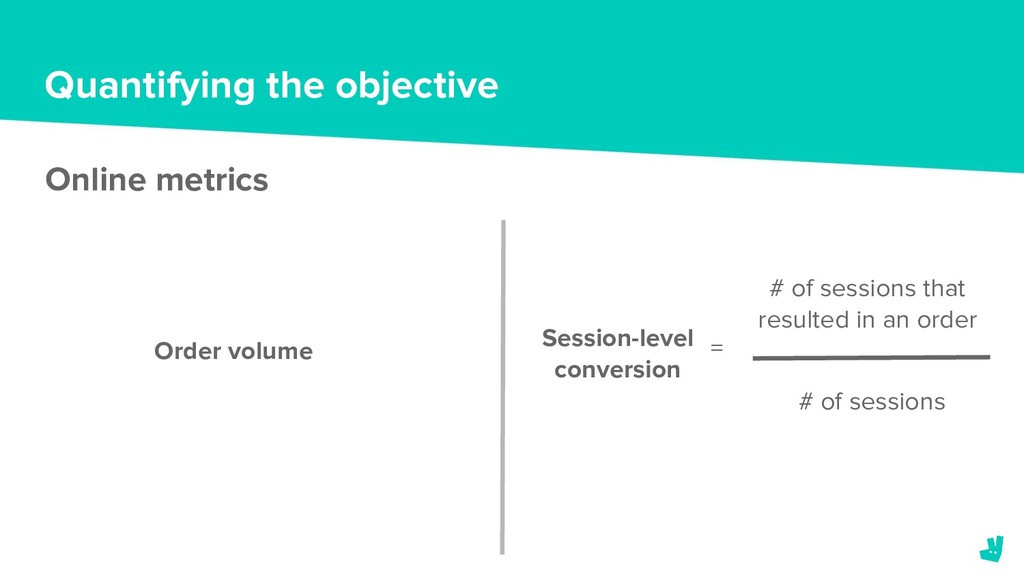
That's an online metric and I'll come to offline metrics later and hopefully the distinction will become clear. But online metrics, these are the ones that we're going to use as that tell us if we're achieving our objective of showing more relevant restaurants. So order volume.
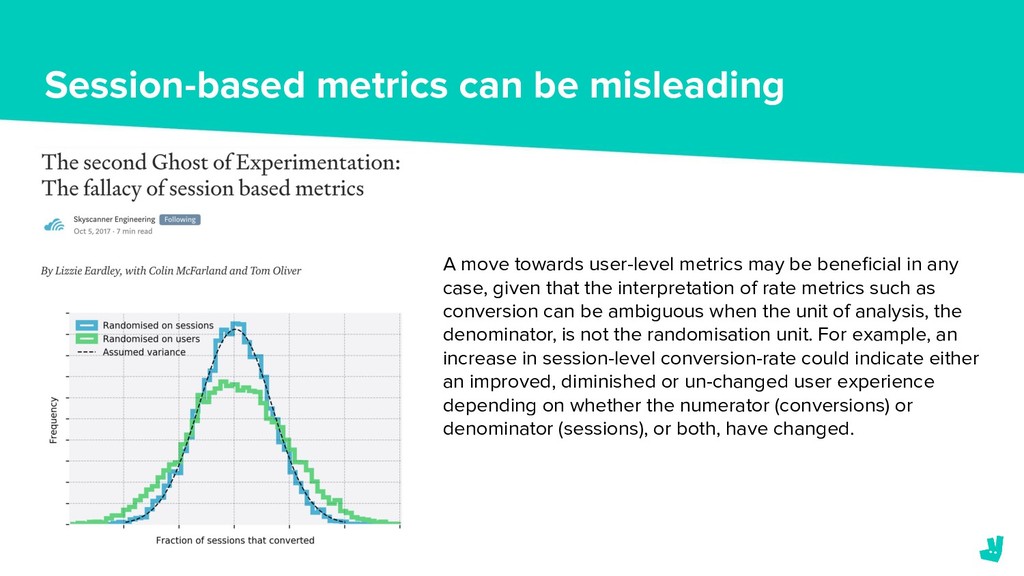
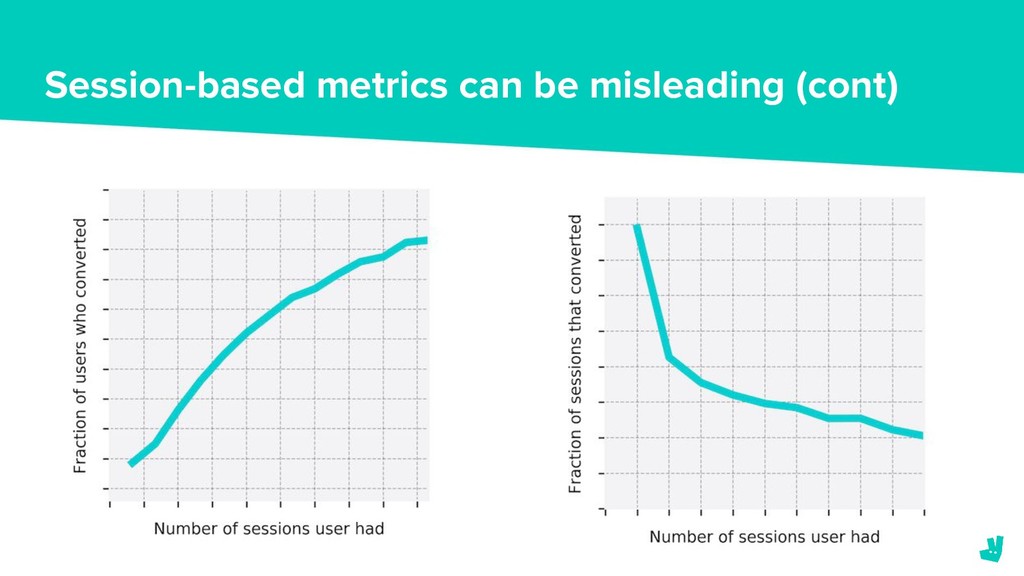
If we have an increase in in the order volume, then it's likely that we're showing more relevant restaurants to customers, and and so that's that's a good thing. We also have this session level conversion. And, I sat next to, a lady called Lizzie.
She was a speaker yesterday. She authored a a blog post that whilst at Skyscanner that mentioned problems with session level conversion. And we're beginning to see those, at the moment. But we we also look at session level conversion, but ultimately, order volume is a thing we want to use.
So order volume is a thing we want to increase. Right? And that is our our proxy for for achieving our objective. Right? So that's what we want to do. How then, as a data scientist, do I turn this into a machine learning learning problem?
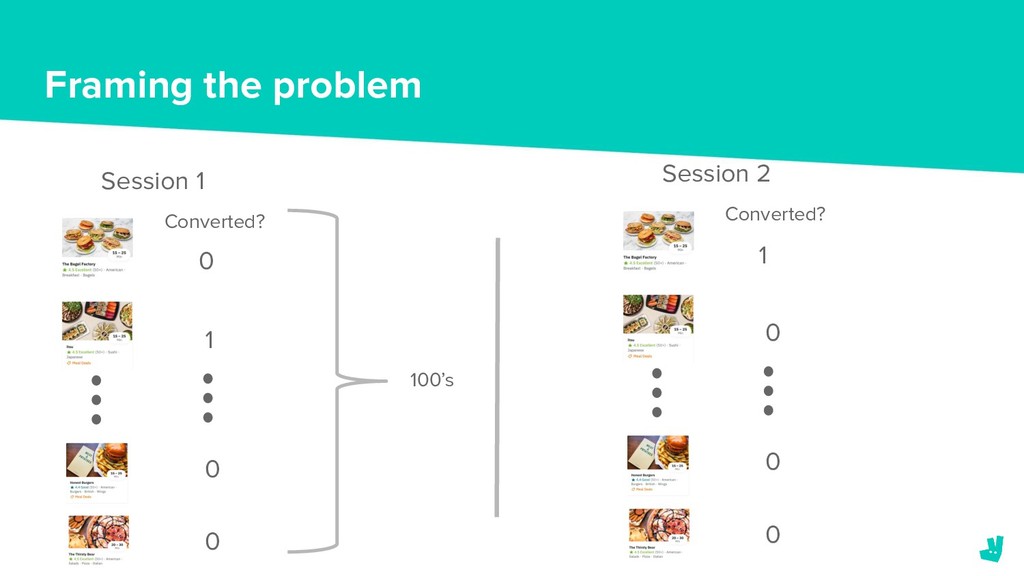
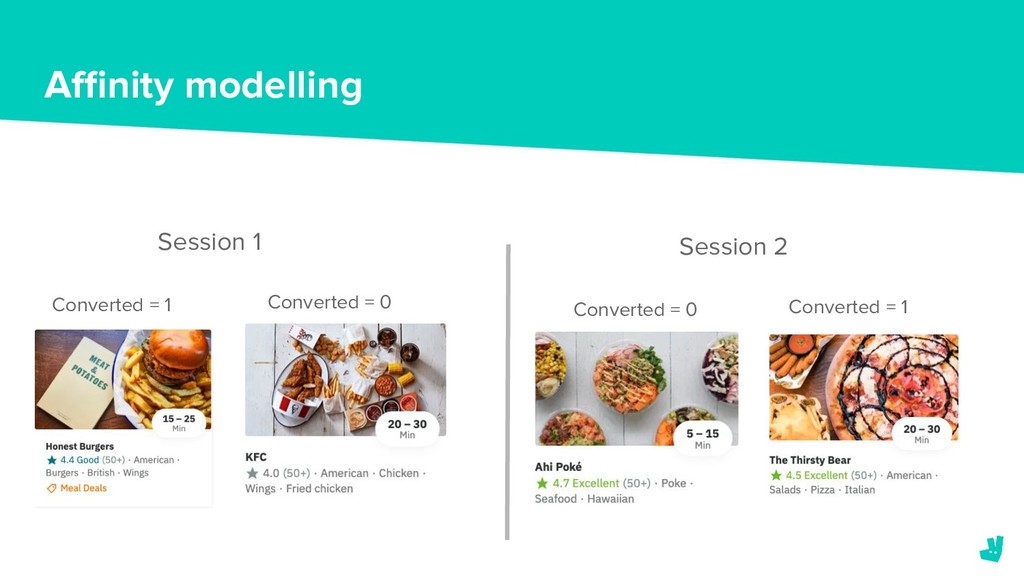
So this is how we do it. This is a single session. By a session, what I mean is someone opens the app and they're presented with a list of restaurants. That's all you need to know. Right? A session. Right? So here is just a list of restaurants and converted basically means, did I buy it or not?
A zero if I didn't purchase it, a one if I did. Right? So this person, who I made up purchased from ITZU in in that particular session. The important thing is this can consist of hundreds of restaurants depending on where you are. You know, dense, cities like London and and Paris have lots and lots of hundreds of of of restaurants.
And so that's just one session. Then I can take another session. And this could be a completely different user in a completely different country, but I was lazy and copy pasted the restaurant list so it looks the same. Alright. But this could be completely different, and and so we actually take tens of thousands actually in our in our most recent model, millions of these sessions, and we're going to build machine learning of models of these.
But in machine learning in in data science speak, this is called our target variable. This is a thing that we want to be able to predict. I want to be able to predict how likely how likely you are to purchase from any given restaurant, right, given a particular context, the time of day or whatever.
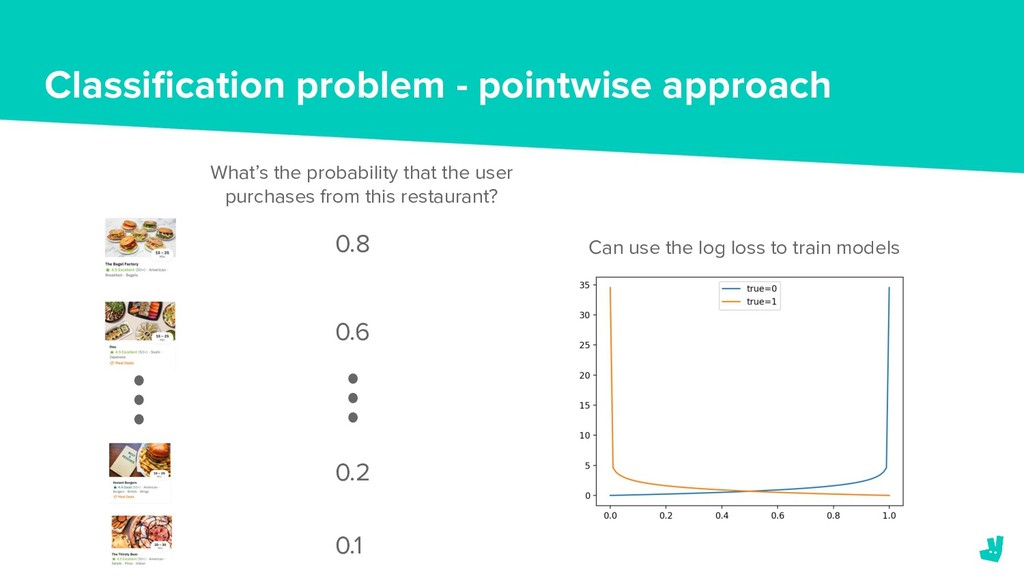
Right? So this is the target variable. And importantly, the way we frame this, so now getting a bit more data science y, we want to do this as a classification problem. That means that I'm trying to classify zero or one, are you gonna purchase from this or not?
And we just ask the question, how likely is it that you're gonna have a one? How likely is it that you're gonna purchase from this? And when we generate those scores, I'll explain, how we do that. We can generate some scores to say what the likelihood is of you purchasing that and then I just rank in descending order and Bob's your uncle.
We have a list. Right? So that's all we have to do. Right? So all all this problem is now is just trying to find these numbers. Once I have these numbers, I can present you with the most relevant list. Right? That's the idea.
And, because we ask this question at an individual restaurant level, so, Itsu, how likely are you to purchase from this restaurant? Oh, zero point six. Honest Burgers, how likely are you to purchase from this restaurant? That is called a point wise approach because I'm actually asking the question at each point, at each restaurant.
Right? So that's I'm trying to give some data science technical speak here. So that's a point wise approach. But the idea is that we can actually use traditional classification metrics for those, data scientists in the room. We can actually use traditional training methods like, logarithmic loss, but we won't go into that.
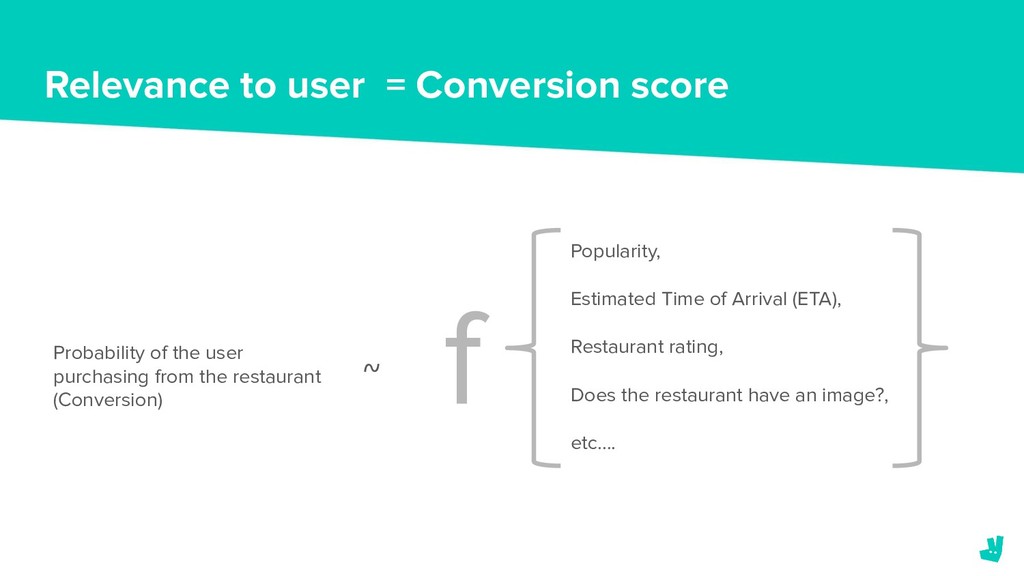
But the idea is that we can frame this as a problem which we can actually solve in a traditional, data science way. That's all I'm trying to trying to say with that. So now that we have our target variable, now that we know what we're trying to predict, right, what factors, what features can we put in to help us predict that?
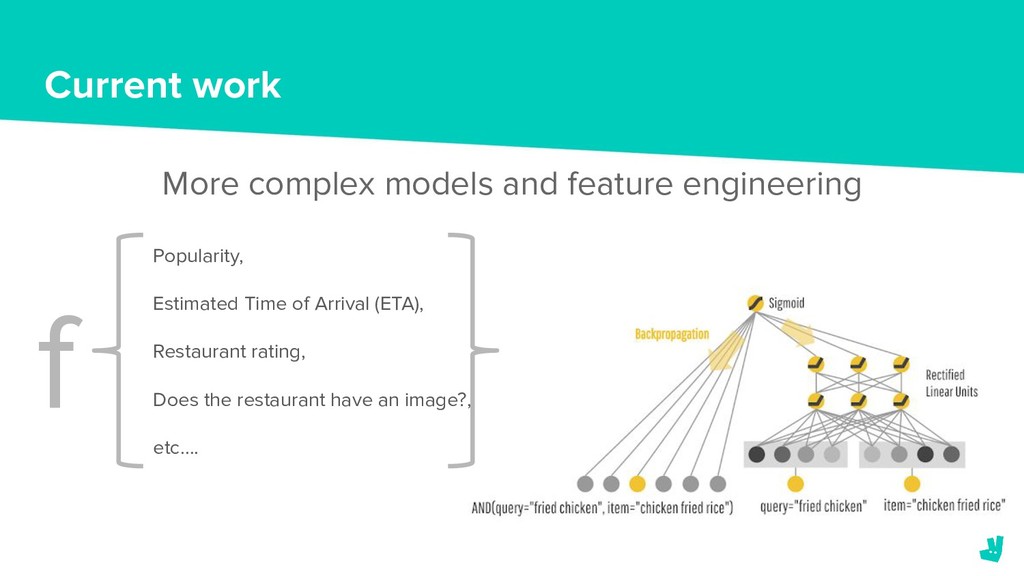
Right? So it might be that the estimated time of arrival. For example, if one restaurant is gonna deliver in fifteen minutes versus the next restaurant that's gonna deliver in an hour, that might be the difference between you purchasing from one restaurant or another.
So that would be a feature that we put in the model because it's slight it's predictive. And so there are loads of different features that we can have. People like to see images. Right? People like seeing food. Right? It gets your appetite all up and and running.
So that is quite a predictive feature. You have to think about some of these because some, like popularity, how popular are these restaurants, they can introduce feedback loops. So if you have a restaurant that's very popular and you stick it at the top of the list, people are more likely to purchase.
So that will have a much higher popularity and then you'll keep putting it at the top. So it's actually you actually have to think quite a lot about what features you're gonna put into a model as to whether they might actually reinforce certain things you don't want to happen.
So in our latest models, we are trying to move away, for example, from putting popularity in because of those feedback loops. Even though your model evaluation will say that it's good to put it in because it's fairly predictive. So those are the sort of things that you gotta think about.
Once we have those factors, once we have those features, we stick them into a box. I'm a mathematician so we call our we we we have a symbol for our boxes. We call it f which is why there's an f on there. So it goes into this magic box and out pops the number.
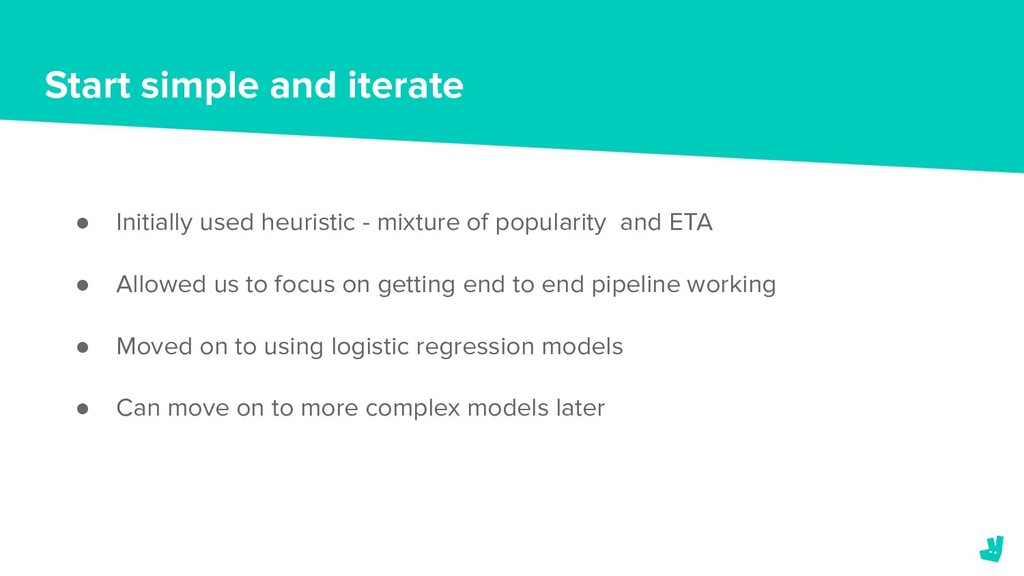
That's the number that I rank by. And there there we have it. An f can be loads of different things. The important thing is at Deliveroo, we like to start simple and iterate. And I would, use this approach for any project. So the first f that we used wasn't even a machine learning model.
It was a heuristic. It was just take the popularity, take the estimated time of arrival, and just average it. Right? It's just a heuristic. It didn't need to learn anything. There was no machine learning in it at all. The important thing about that is that we need to be able to serve these, rankings.
Right? We need to build an entire infrastructure to be able to to actually give customers a ranking. And so I don't want to be bogged down with mistakes due to a complex model. I wanna make sure that we have the infrastructure to do it first.
So start off with a simple heuristic. Start off with something really easy because this just has to be good enough. It doesn't have to be perfect. So make it good enough, get your infrastructure sorted, and then you can start iterating on more complex models.
So then we start moving to something called logistic regression. And then deep learning, you might hear about all the time. It's the it's the huge, rage now in in in, machine learning, these deep learning models. So now we started using for some of those.
But start simple. Okay. So we've got to the point where we know what factors we're gonna stick into our model. We know what predictive things. We then generate the scores and we rank them in descending order. I have a I have a list.
I have a ranked list. Now I need to know, is it any good? Right? So this is what this slide is about. Is it any good? Can I evaluate this? So I could put it into production, put it in front of customers, and see what happens to the order volume.
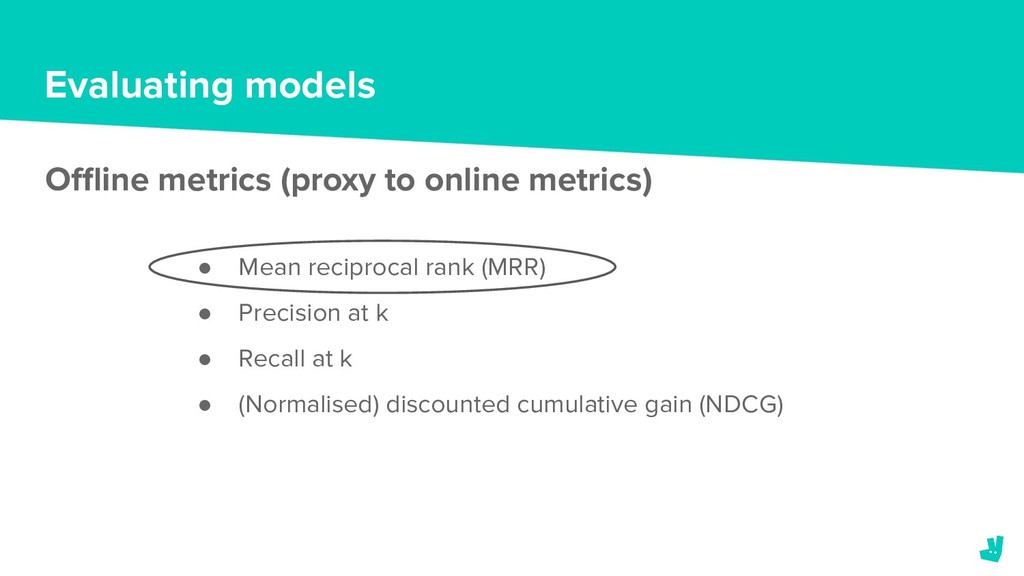
But maybe my ranking's really bad and actually that is a really bad experience for the customer. So how can I evaluate the model before I put it in front of users? That's what an offline metric is. And so these are the metrics that are more familiar to data scientists because we use them very lot a lot to evaluate whether our models are actually any good before we put them into production.
And so I've written four of these these things, up there. Basically, they're a variation on the same thing. So I'm going to explain one of these, which is the the one that we actually decided to use, mean reciprocal rank. But all of them are are are very similar, and it just depends on what sort of context, that you're doing a ranking that you might use a different one for example.
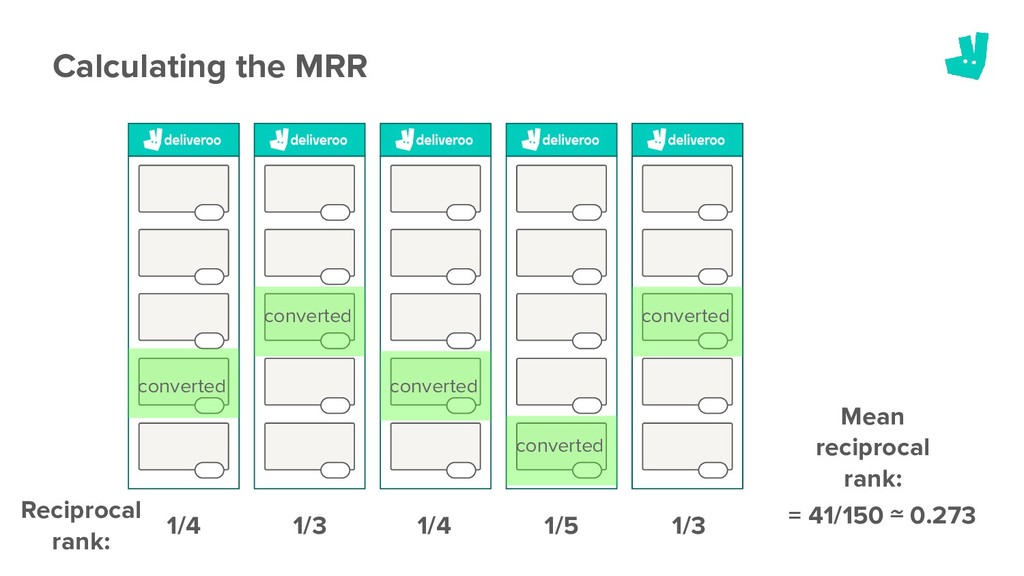
So let's talk about the mean reciprocal rank. What actually is it? So let's say I have five sessions, right? So there's one on the far left and that has five restaurant cards and the user converts or purchases from the restaurant in the fourth position down.
Well the reciprocal rank of the fourth position is one over four. Right? In the next session, they convert from the third card, reciprocal rank of that is one over three. And we can do that for all of the sessions. Remember I said that in our training set, we'll have millions of these sessions with hundreds long.
So I'm calculating the reciprocal ranks of each one. And then the mean reciprocal rank is just the mean. Just take the mean of all of those and there we have it. And so I have a score. And so the idea of this particular metric is saying, if I can place if I can write an algorithm that will re rank the list such that the the restaurant that the user ordered from was as high as possible, I'll get the best score.
Right? So the maximum score I can get is one. Right? So the higher this number, the more likely is that I'm I'm I'm actually placing that restaurant up and so it's it's kind of like a proxy that we're trying to place the most relevant restaurants as high as possible.
So that's a proxy. Right? This is the metric we used and I'll come back later as to why it's not all it's it's cracked up to be. But for now, take it as a given. Mean reciprocal rank, higher is better. So that's explaining how how it all works.
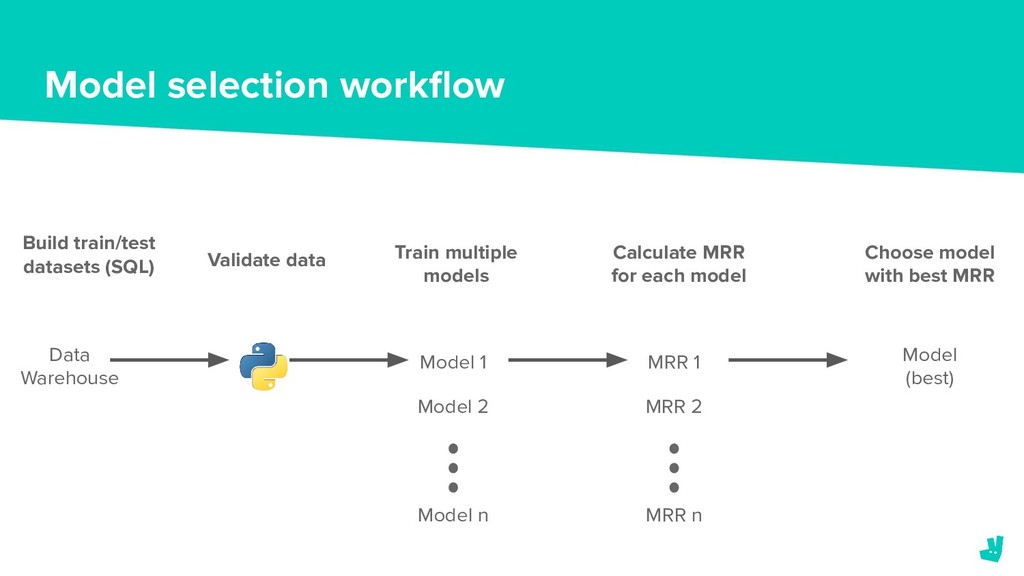
This is the this is the actual workflow. So how do we actually do this? Well, we have a a a a data lake. Alright. A data warehouse that we we write some SQL and we have to generate all of those features I was talking about.
We generate all of the the sessions, the target variable, the zero ones. We have to write a whole bunch of SQL to to then get all that data out, and then we pass it through some scripts. We need to make sure that the data actually look like what we think they look like.
Because if you've actually looked at a lot of tracking data, you'll know a lot of mistakes in there. There's no missing values. There's duplicates. There's a whole bunch of stuff that isn't isn't all that great. So So we have to validate this. We have to make sure that we're getting the data that we expect, and then we train multiple models.
So it might be that I take two features. So I mentioned that, one of our earlier ones was popularity and and estimated time of arrival. But then I might wanna train a model that has another feature of of, does it have an image or not?
So that's a separate model and I can train loads and loads of these, n of these. And each one generates a different ranking of that list. Right? So now, because each one is a different ranking, each one has a different mean reciprocal rank score.
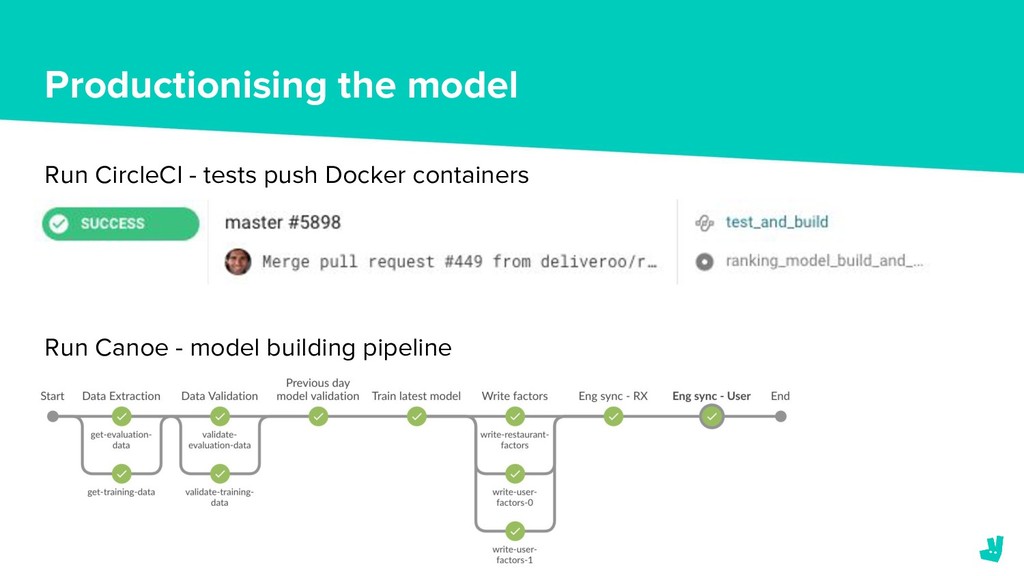
And then we just choose the one with the highest number. Simple as that. And then that's it. Now I have the best model and that's gonna be the one that we're gonna put into production. That's gonna be the one. So to do that, we, have to run it through our continuous integration tool which is called CircleCI.
It basically runs a bunch of tests to make sure that, our code is doing what we think it should be doing. And then we have a an in house built machine learning pipeline which we call Canoo, and we basically just it's basically just run a bunch of scripts one after the other, extract the data, go validate it, go train it.
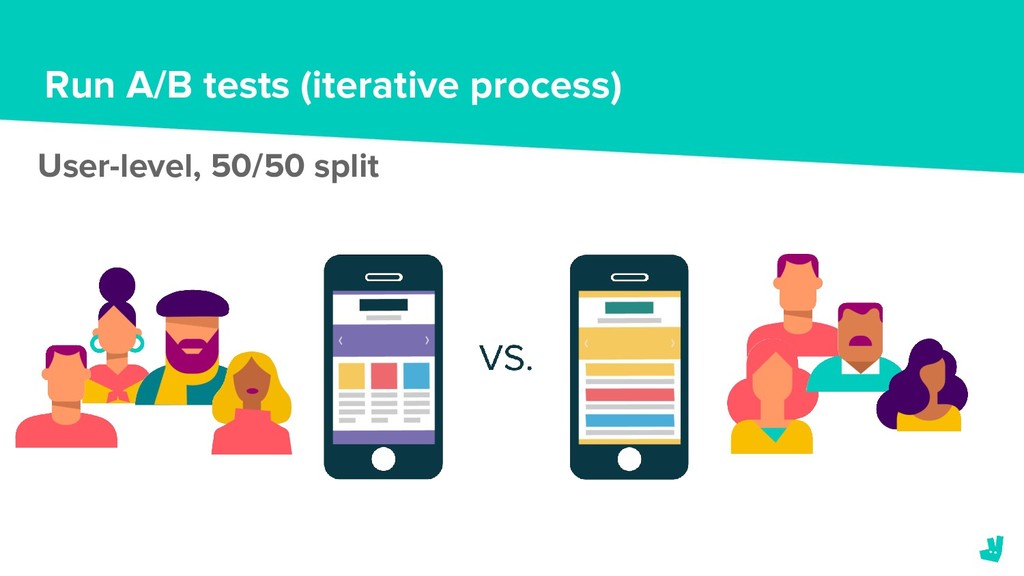
And then if it's all green and with ticks, it isn't always like that. If it's green and with ticks, then we're all good. We have a model. Let's do this. And now we can go and AB test this. We can actually check. So what we'll do is we we do something we randomize or we we basically give fifty percent of users the old algorithm and fifty percent of users the the new algorithm.
And then we'll just see what happens. We'll measure the order volume. If it goes up, release. If not, well, try again. So we'll keep doing that. Even if our our AB test says that we should release a ranking algorithm, right, we typically try to spend about two to three weeks trying to select which models are best.
But we know we haven't chosen the best one because there's gonna be more stuff that we can do. And so this is an iterative process. We've done this several times, and it's still ongoing. It's still ongoing. We're still improving, and changing the algorithm.
So we've got experiments running now. Fifty percent of you are probably getting different algorithms. So the other fifty percent, who's who? Don't know. Don't know. So yeah. So what we're gonna be doing, as I said, we're we're trying to look at more features.
What features are actually more predictive? Can I find more things? Can I get more signal to understand what things I should recommend you? And also trying to to get into the deep learning space, like, I wanna be one of the cool kids on the block and use these neural networks.
And, yeah. So that's what we're looking into at the moment. So that is how we frame the ranking problem. That's that's how we we we go about doing it. So what tools do we use to actually do this? How have we, managed to, me as a data scientist, work with engineers to get this actually served to to our to our users.
So we have the the challenge with, building these ranking models is that some of the features we need to be able to get and serve in real time. So the estimated time of arrival is gonna be very dependent on the time of day, how many orders that restaurant already has, what are suppliers, right, do we have enough riders, is there a lot of demand at the time.
So we won't know this in advance. Whereas things like if we use popularity, which is like the past order volume of a restaurant, I know that I can write a a SQL query. I can batch compute that and just store it somewhere and just take it out of a database when when we need.
So we need to be able to handle, both real time, and and and batch, features. So we're thinking about how do we how do we productionize these? How do I get data scientists like me to speak to engineers in such a way that we can serve these things?
So the way that we've and we've been doing this for years at Deliveroo, whenever we have any model, not just a ranking model, any machine learning model, is data scientists like myself, we generally write in a in, a prototyping language. I use Python, which is why I put Python up there.
Some use r, Julia, whatever you want. It's quite different from what engineers use in to to to write their production code, the the code that actually serves the app. Our engineers and our team use Go. That's what yeah. For those that don't, that little gopher thing and weird looking animal thing, that is the the the the mascot for Go, the programming language.
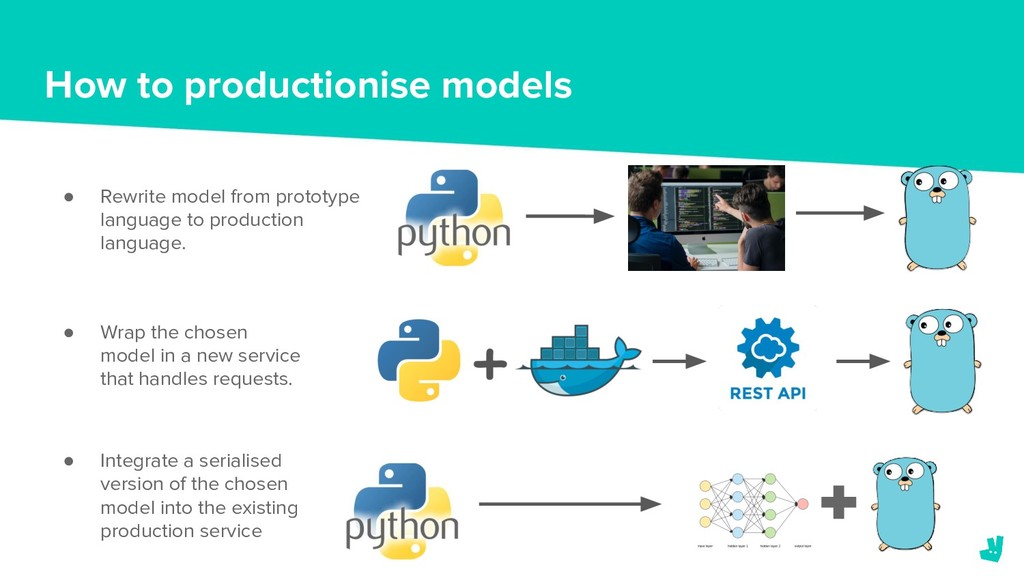
That's what that is. Sorry. I I realize now that it doesn't make sense if you don't know. Yeah. It's just a weird animal there. Yeah. So what we what we end up doing for years at Deliveroo is we would prototype and write and do all the model selection, picking all of the models in one language, and then we'd say, okay.
Now we've picked the best one with the best score. We're gonna sit down with an engineer, and we're gonna rewrite this again in this new production language. Right? We're gonna redo it. Now you can imagine, one, it takes a long time. Two, there's a lot of mistakes.
But three, it limits the complexity of the algorithms that we can use because I'm not implementing this, a neural network from scratch in a language I don't know. Right? So we we typically just use linear models. Right? And that's been the case for years.
We said we don't wanna do that anymore. Right? So what other solutions are there? So the other one, we like to use weird, like, animals and things to I I I it's only now that I'm really so this thing here, is is the logo for for something called Docker, for those that don't yeah.
It it's this is weird. Sorry. So the thing that we're gonna do is we were gonna basically write, our our in our prototyping language, in r or Python or whatever. And then this docker thing, this whale, we then put it in this thing called a container, and this would would then spin up and then we'd write a little interface, a little API that can then speak to the production language and pass the the the recommendations, pass the rankings.
Right? And so that we're gonna do that. But then the engineers so this is I'm not an engineer. I don't really understand all the back endly things and and all that. That's that's beyond me. They're worried about basically what happens if if you've got loads and loads at peak times.
Can we scale each of the services in the right way and handle all of the requests or are they gonna get slowed down and is it gonna be a bad user experience? I don't know anything about this stuff. I just let them let them let them have a chat.
So we decided not to go for that with that method. The method we decided to go through is to say, let's write in a product in in our prototype language, so R or Python, but let's save it into a format which can be read by other languages.
So we're gonna save the model as opposed to spin up our own container, save it, and then have that particular thing we save as is language agnostic. And so we can just read it from the other language. So that's the reason why we picked TensorFlow.
So TensorFlow is is a is a framework, written by, and released by Google. And it allows you to do basically a numerical computation scale. But the main reason why we wanted to use it is because it saves to a format, called a protobuf, Google protobuf format, which can actually be read by multiple languages, different languages.
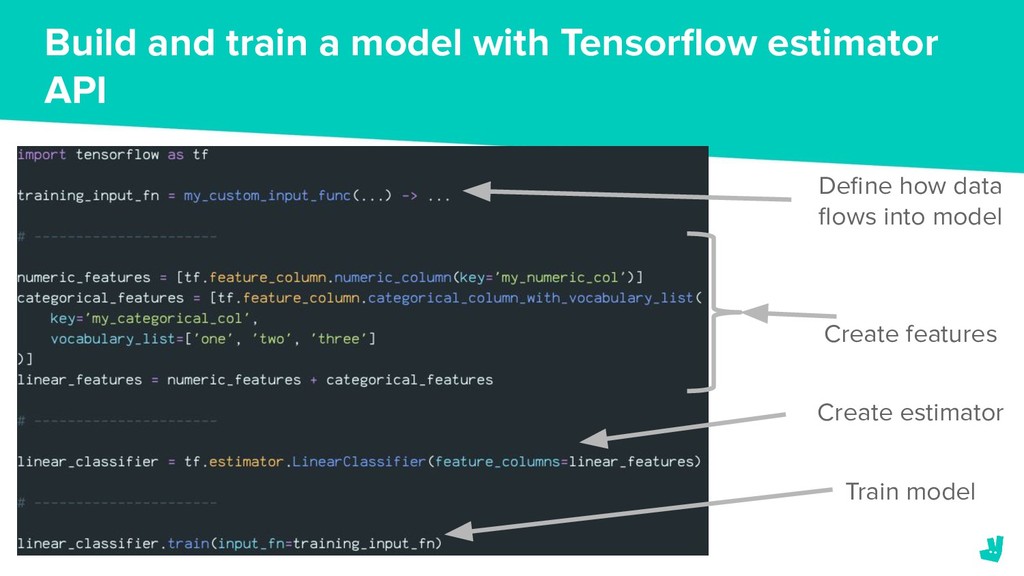
So that's the main reason. But it has quite a big community. It's got good examples and it's also got this thing called an estimator API which which makes it, like fairly easy to build models, but it still tends to flow. I'm still not really used to ten I I still not not big big fan, but we use it.
We use it. Don't let anyone from Google hear me say that. They're probably looking at me anyway. So no one likes code. So basically, the the main thing no one likes code. The main thing I I demonstrate with this slide here, this is I I also don't write in Go.
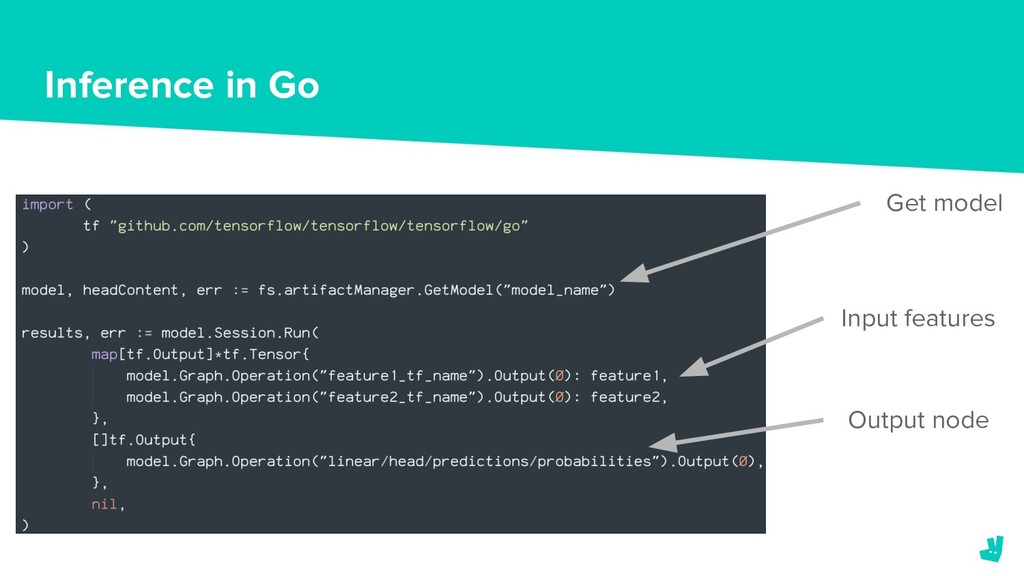
This is my attempt at stealing the Go code that was online, and trying to put it in a way that tried to make sense to people who wrote Go. But the idea here is that when we save something, so there's like model name, get model.
Right? And then we just take that model, do run the session, and but we just pass the features in, and then we say, this is the probability that I wanna get out. The important thing for those that don't really care, don't worry about it.
For those engineers that understand that that are looking at this, this is the the as simple as it is to actually get from a safe model that we have to actually generate the predictions in the production language. And this is actually what the engineers write to be able to to get the the predictions that we want.
So that's that's what this slide's like. But, yeah, let let's no more code. No more code. So we've also been looking at, Amazon SageMaker. I I was demoing this yesterday for building and and making models easier to train and build, but it also has you can also deploy endpoints with this.
So, you know, I said that we didn't choose a second option of getting our own container and getting an an endpoint, an API to speak to. Yeah. Now we're looking into this, using SageMaker. So yeah. We might be backtracking a little bit but, you know, it's it's alright.
It's alright. So yeah. It's actually a really good tool for for doing training even if you don't want to use it to to deploy models. So if you are limited or or hindered in training models at scale and and doing model selection, I definitely would suggest looking at something like this.
So we've run a whole bunch of models. We've trained a whole bunch. We've run a whole bunch of experiments and we've learned a lot along the way because we made a whole bunch of mistakes. So I'm gonna cover a few things, that we've learned and hopefully, you guys can take with you in in some projects.
Yeah. And don't make the same mistakes we did. So the first thing is, as a data scientist, when we write in models and I'm training them on online and stuff, like, we we have to write SQL code to extract data. And then I run model training, I then get a model.
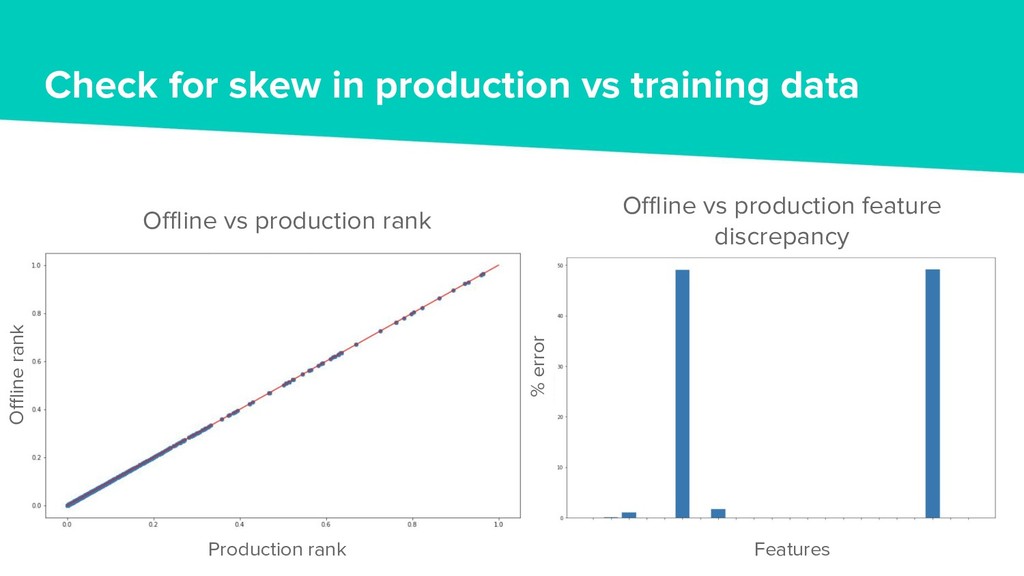
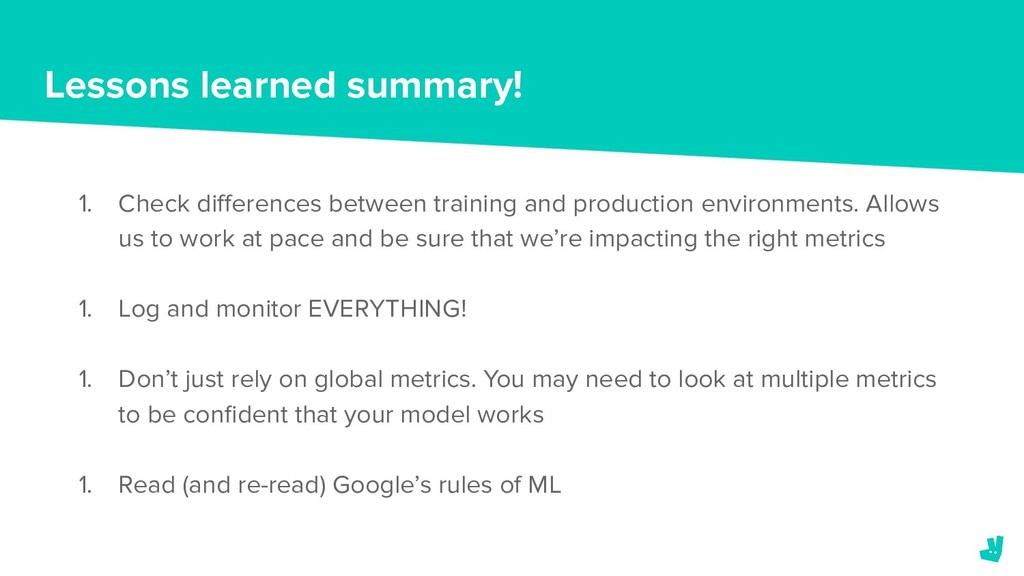
And as I said, we go through the process, choose which one, get into production, and then we get something served. Right? Check that the model that you actually put into production is generating the same ranks as the one that you tested on before production.
So we weren't doing this to start off with, but we are getting really weird ranks. We're getting really weird stuff and we couldn't understand why. And then we decided to just do a plot like this. So this is literally what is the rank in production?
So is the restaurant in position one, two, three, four, five? And what's the offline rank when I do it with my sequel? Is it in position one, two, three, four, or five? And just check that one matches one and two matches two. And if it does, then it looks like a straight line on this.
I've shown you a perfect one because, yeah, I I do it very no. I don't. I just made this up. But if the dots are not in a straight line on this graph, which they rarely are, especially to start off with, that means what you are serving to customers is not what you're expecting.
And you should check this. Right? You should check this. And then the the main thing that we end go to do afterwards is we say, let's take each of our features. So one might be the estimated time of arrival. One might be what might be the customer segment.
And then try to work out, does it match what we did at at serve time? So one example is for for customers that don't always come back to delivery, you know, you get those customers who come all the time. They're always on there every day, blah blah blah.
And you get some who are, like, very occasional and come back once every few months or whatever. So for those occasional customers, sometimes they go back so far, they haven't ordered in so long that in a production system, we we we forget them.
But in our SQL database, we haven't. So we were classifying them offline as just occasional customers. Online, those same customers were being classified as new. So we were getting different numbers for this. And that's one of those things that we that we didn't know.
Because as a data scientist, I'm not intricately, like, I don't have intricate knowledge of the production system and how it works. So these are the types of things that we need to check to make sure that we're producing the same things offline as we are online.
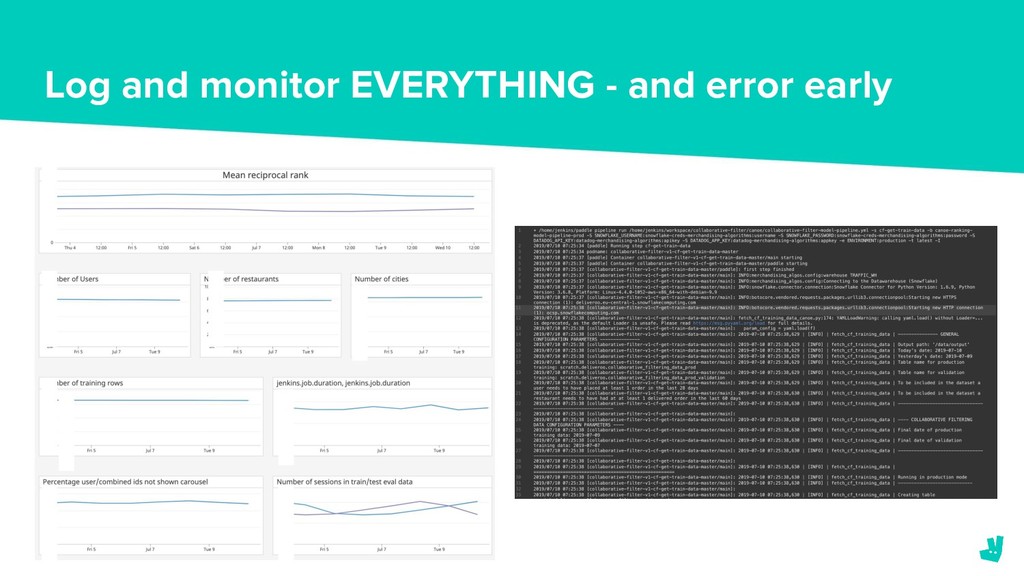
So now we always do this sort of analysis before we before we release something. This is something I am I bang on about all the time. And I'll I'll just give you example. So they just log and monitor everything. So there was there was a tie well so if you're building machine learning models and you have them in production, we train them every day.
Right? We train retrain it every day, and so you have a different version of that model every day. It's retrained on new data. Right? I'm not looking at that every single day. I'm not looking at it. So if it passes, great. If it fails, then I'll get a notification and I'll look into it.
But at that point, the only thing you have, that that black screen there, that's all you have. These logs, whatever you output. So if in your code, you don't write you don't write down what's coming out and at what stage you're at, you are lost.
And so you have to, like, go through your scripts, rewrite everything. There was a time where, actually, we changed our tracking. Well, we changed the way we track things. You know what the only change was? That lowercase became upper case. But my c my SQL was case sensitive.
It was case sensitive. So we got nulls. We got nulls. But we we we wasn't logging this. We didn't log this. I didn't have a beautiful dashboard. I didn't know this was happening because I didn't get a notification saying anything was wrong, but there was.
And so after day after day, getting nulls, nulls, nulls. So I didn't know anything, but the model was training on less and less data. It was overfitting. It was then what I mean by overfitting is basically the model works. It produces rubbish. Right? So it's producing rubbish.
This is in production. This is in production. Right? People are getting this. Right? And then the only time I knew was when it got to a point there was zero data. And that's when my model that's when my model failed. I didn't know it was a SQL at that point because the script that told me it failed was a point at which I'd pass it to the model.
So I had to go through all my scripts. I was like, oh, this is not bad. I wrote good code here. And then you get to the validation. And, like, this this looks fine. And you get to the SQL, and you're like, the SQL looks fine.
I've read it all nothing. Right? And that if I had actually logged all of that information and said, actually, what data is coming out at the end of, yeah. How many rows of data am I getting? Am I getting yesterday's data? If not, fail, alert me.
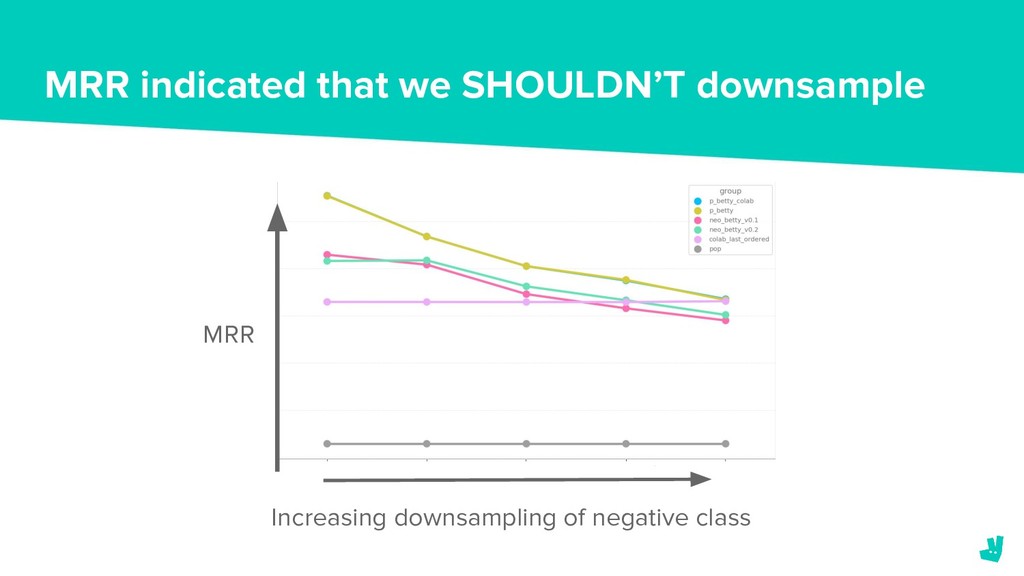
Then that would have been, like, hugely saved a lot of time, a lot of hurt, a lot of tears. So log everything. And finally, one of the things is the, the global metric. I told you about mean reciprocal rank. Global metrics can hide a lot of things. Right?
They can tell you on aggregate, are you doing well, if you choose the right one. But actually, what we were finding was our global metric, even though that our mean reciprocal rank, even though that was going up, when we released experiments, it wasn't actually our order volume wasn't going up.
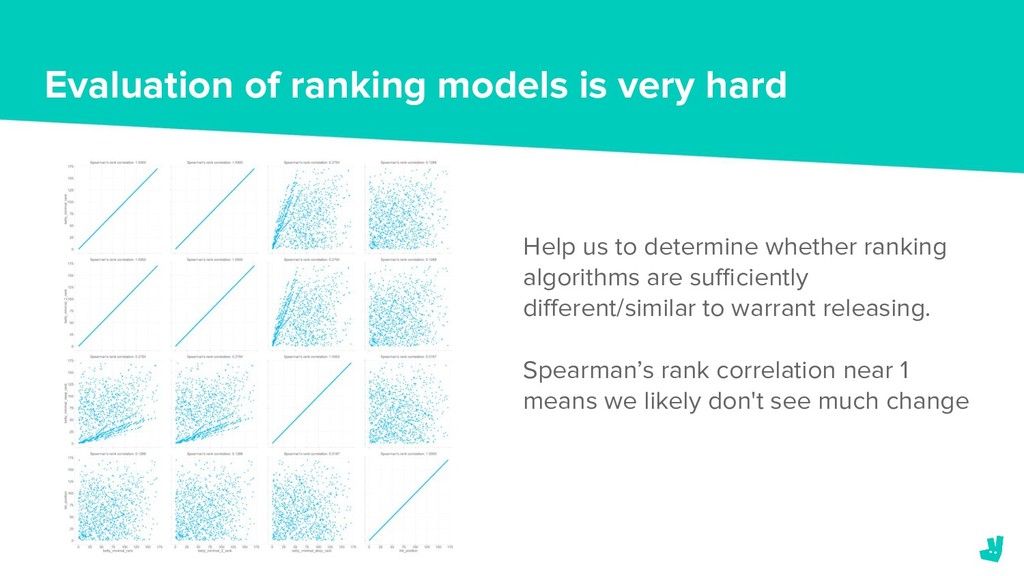
It was a bad proxy. It was a bad proxy. So do not just rely on your global metrics. We actually produce scatter plots. I'm gonna rush through because I'm starting to it's it's gone amber now. It's gone amber. So, yeah. Basically, we test our different models to work out whether the scatters are the same.
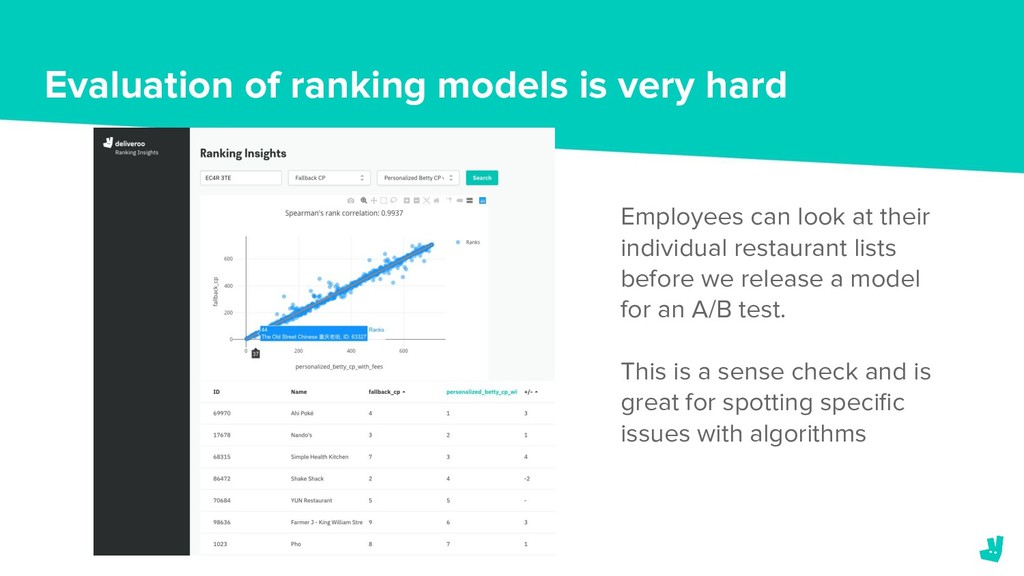
If they're very different, we know we'll get very different, rankings in training sorry, in in production. And so I know that the consumer is likely to see something very different and we're likely to see big changes. And we've also written a tool where we can go in and check our rankings ourselves.
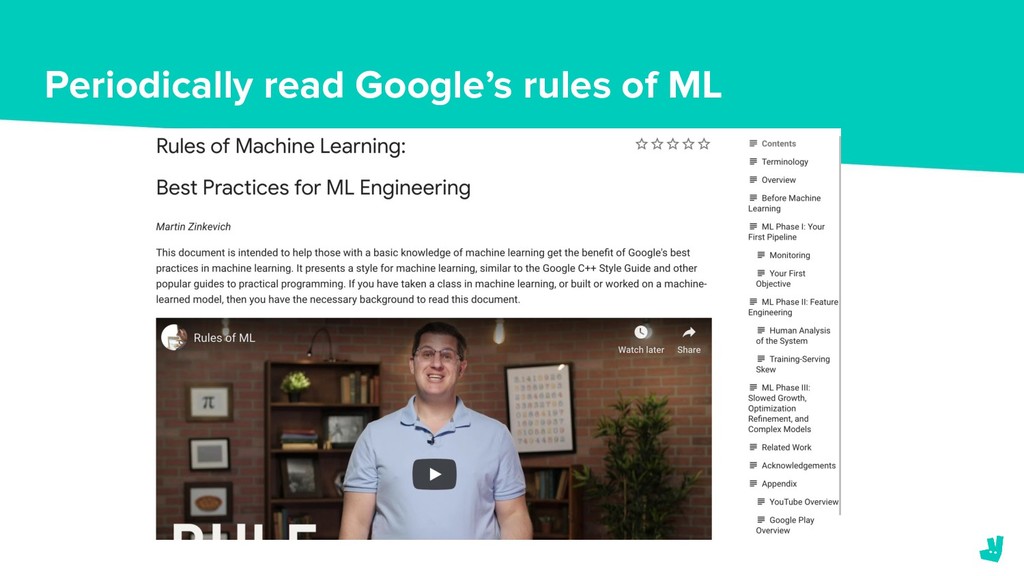
So I can actually see what restaurants I would see before we release this to to customers. So that's what we go ahead and do. And then finally, because it will stop, Google rules of machine learning. It's fantastic. It is really, really good. Go back, read this, reread it. It's it's brilliant.
So, yeah, that's the lesson third summary. So wrapping up, it's gone red now. So I'm I'm lit I'm coming off. Yeah. We we make ranking algorithms. It they they work. We made mistakes, and we've learned from them. Also, sorry. We have pricing teams and logistics.
So I've just spoken about algorithms in in ranking, but we have different algorithms teams, and we're doing experimentation platform as well. Fantastic. So I don't have a stand. Remember, I did this talk before. Don't have a stand. Come see me anyway or anyone wearing delivery shirts.
We're hiring. Come and join us. And finally, thank you for listening.