
So many tools out there, so much data now available - all making it easier to drown in numbers that don't help move the needle. So what does a great analytics strategy look like in 2016? In this talk, Andy shares actionable tips, techniques and advice from working on marketing and growth with 40+ companies across 500 Startups' portfolio.
← All talks 


























Grow Marketing Turing Fest 2016
Data-Driven Growth: Analytics Tools and Tips for Marketers in 2016
Auto-generated transcript - may contain errors. Tap a timestamp to jump the video.
Okay, so, yeah, welcome to the session on data driven growth. I'm Andy, thanks very much for having me. This is my Twitter handle, so please use that to direct any comments, feedback, heckles, abuse in that direction. It's great to be here in Edinburgh.
I'm actually a quarter Scottish, which I assumed was how the speaker running order today was calculated until Mike came up here in his kilt this morning. Now I'm not so sure. To introduce myself briefly, so for the past year, I've been with the VC firm five hundred start ups, working with over forty of our portfolio companies, helping them with their growth.
Alongside that, I do freelance consulting. I'm working on a project with the web audience measurement firm Quantcast. Prior, I spent two years doing sales and operations as the country lead for Stripe here in the UK. And then before that, I rode the start up roller coaster as the technical co founder of my own company, Group Spaces.
Way, way back, I built a Facebook application, selective tweets that some of you may have encountered. Somehow, and I'm still not quite sure, but that reached over a million users over a period of years, so that was quite something to watch. I really can't take credit for that, but people found it useful.
What I would like to do today is take all of these experiences from people I've worked with and projects I've worked on, and share with you a series of tools, tips and techniques about how to use data and analytics in order to get growth.
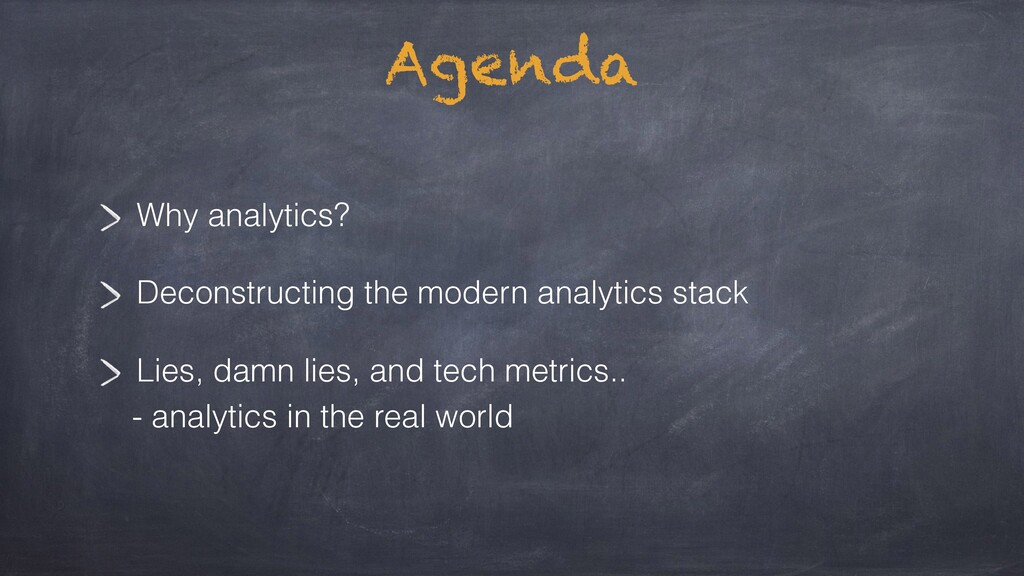
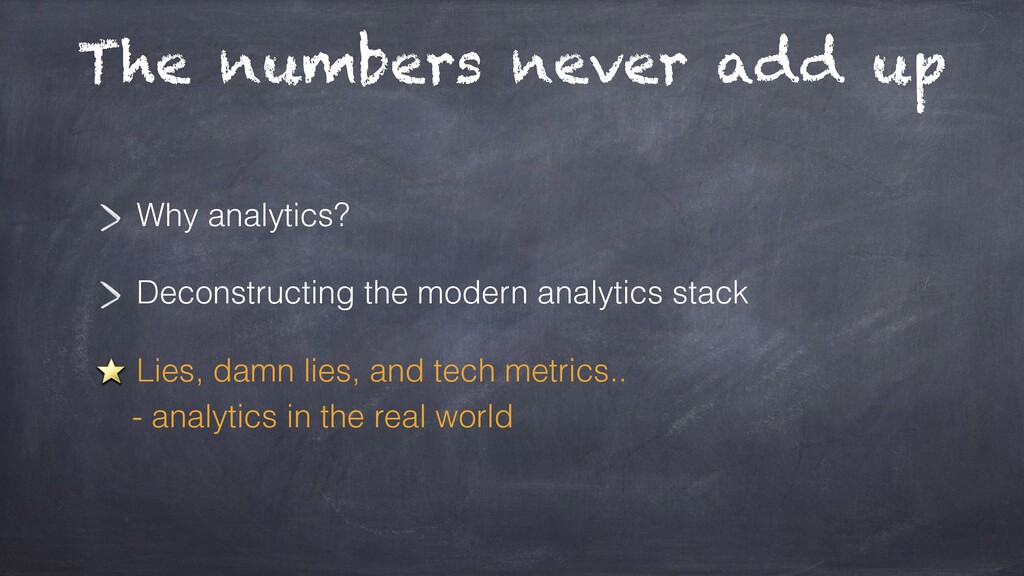
So, the agenda for today, first of all, why are we here? How is this useful? Why analytics? Next, take a deep dive into deconstructing what the modern analytics stack looks like in terms of tools and platforms. And then finally, down lies and tech metrics, open up a little and share some of the truths about what happens when we take all this perfect theory and apply it to reality in practise.
So, without further ado, why analytics? And the important thing to ask here is, why analytics? What are we actually trying to achieve? And this is important because today we're super fortunate to have a plethora of platforms available to us that make it super easy to jump right in and start collecting vast amounts of data.
And the thing here is, don't start with the data. Right? This is my dad. And he worked from a home office, and oftentimes my mum would come in, enter the office and discover he had been reading the dictionary for half an hour or more.
He'd gone there to look up the definition of a word, and in reading that definition, he discovered a new word. He'd be like, okay, I'll look up this one. And so on and so forth. And he got sucked in, spending so much time having a lot of fun, but forgetting exactly why he was there in the first place.
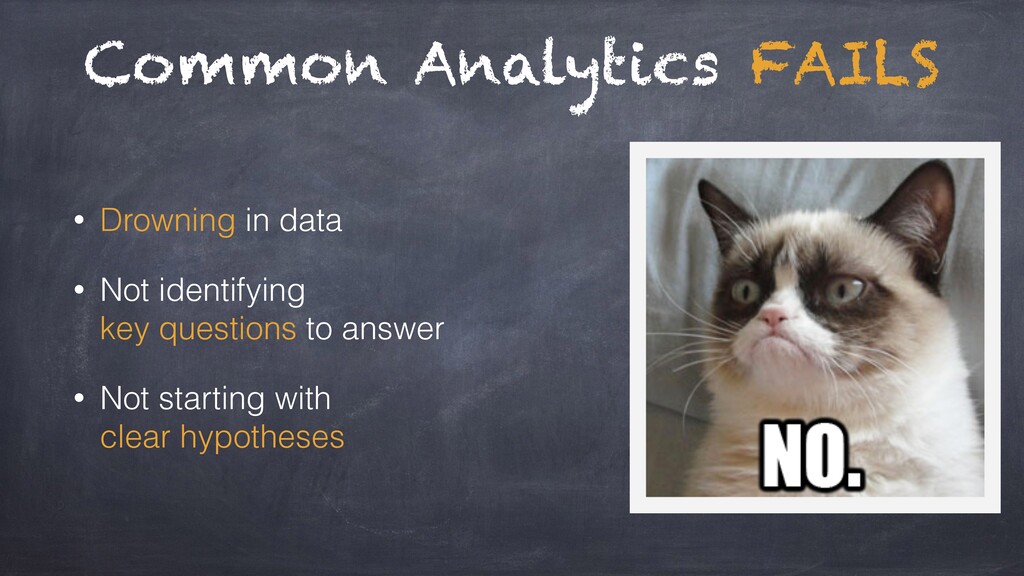
And this is exactly what happens when we start with analytics by collecting the data and just saying, oh, what data have we got here? So, the common analytics fails that I have screwed up in the past, particularly with group spaces, and a lot of the start ups I have worked with, I see drowning in too much data.
Not identifying the key questions up front that we need to answer. Not starting with clear hypotheses, things that we believe or suspect and want to prove or disprove. We don't want to do any of this. We use analytics because we need to know how we're doing.
And there's questions how we're doing for our overall business or products. Are we growing? Are we being successful? But then zooming in to the day to day, the week to week for our individual experiments, our marketing campaigns, our different customer acquisition channels, like different customer segments.
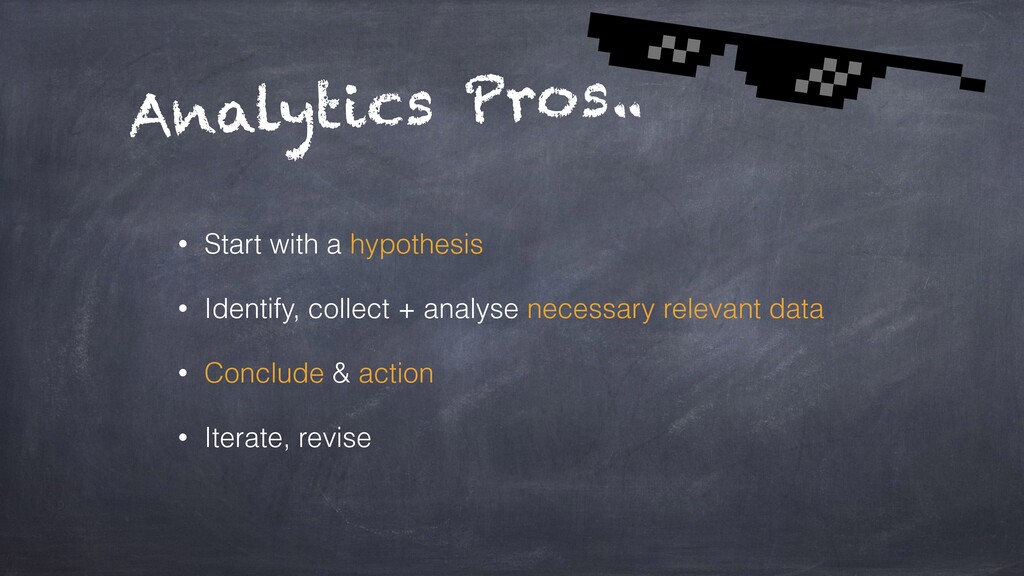
And for each of these, we want to ask the questions what is working? What is not working? Where should we be focusing for improvement? So the analytics pros, the people that I see being really successful have worked with, they start with a hypothesis or a question.
Because only then can they identify and collect and analyse the necessary relevant data. Yep. And that's good. But it's so easy to look at the data and then move on without doing proper written conclusions. And it doesn't need to be lengthy. Just take a few notes about what did we learn.
And then moving beyond that, what are we going to action differently? Are we going to roll out this campaign, build new campaigns in the same form? Are we going to try different things in future? The best people use analytics not just to conclude an action, but then to iterate and revise what they do in future based on the learnings from piece of analysis done before.
So this is analytics pros. So talking about analytics for growth. Talks about analytics, but what do I mean by growth? Getting more stuff, typically more users or more revenue. They're intertwined, but oftentimes for a company, we'll be prioritising one over the other, so it's useful to call out exactly what are we trying to achieve, depending on the stage of the product or the company.
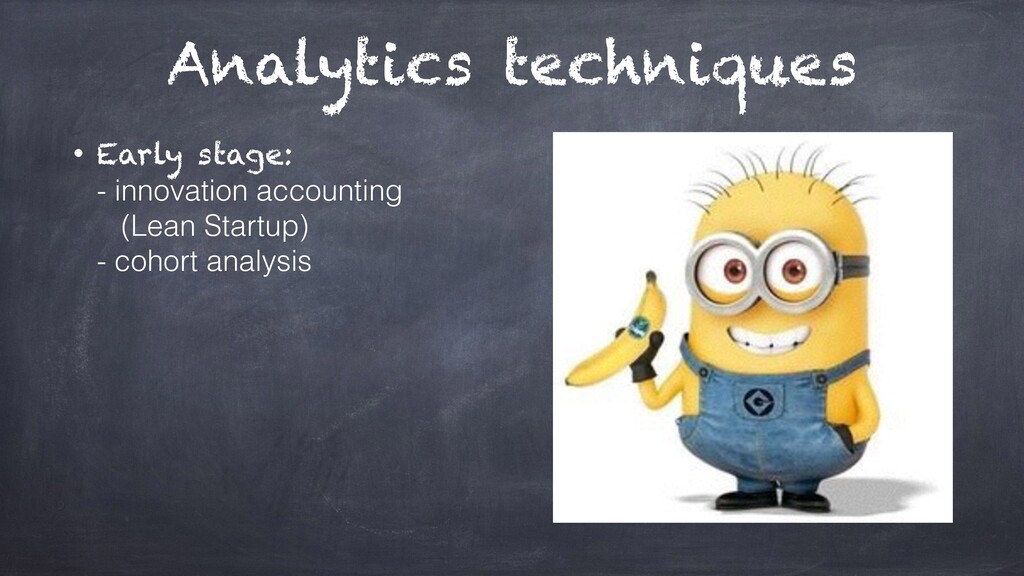
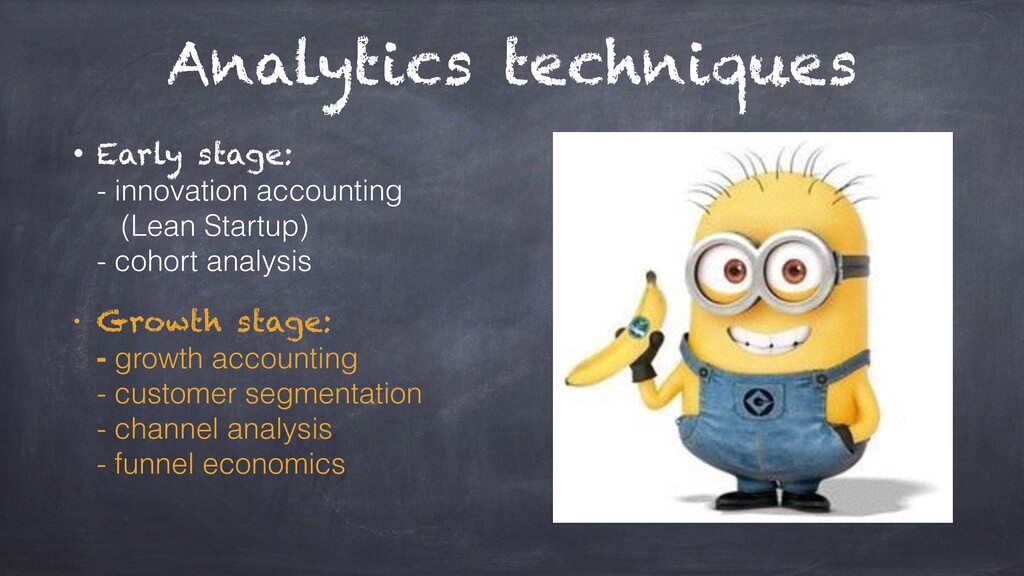
There's a lot of different useful techniques we can use. At the early stage, techniques such as Eric Reeves' innovation accounting, cohort analysis. Hopefully everyone is familiar. At the growth stage, when we scale up, techniques such as growth accounting, I will cover quickly, customer segmentation, the analysis of our marketing channels, and looking into the economics of our funnels.
So these techniques are all great, but we need to be clear on what questions we are trying to answer. So, at early stage, what are the questions? If we are just launching a new product, maybe it's a new start up. The key question is typically are we getting traction?
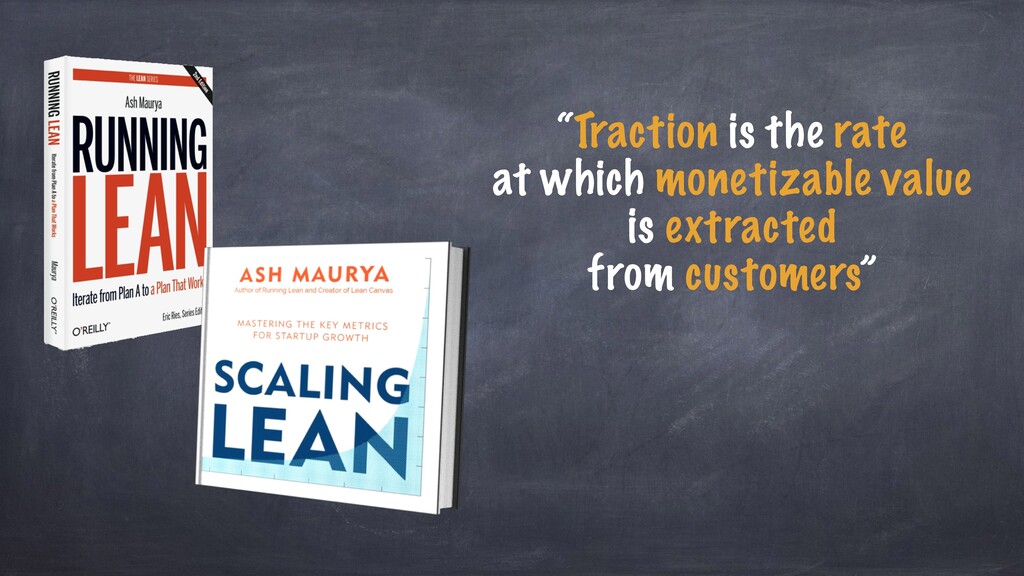
And Ash Moria, the author of Running Lean and Scaling Lean, two books I highly recommend, he defines traction as the rate at which monetisable value is extracted from customers. Okay, that sounds a little academic, but basically it's the rate, so how fast are we creating something valuable that maybe in the early stages we won't be making money right away, but we will be able to monetise over time.
This is not vanity metrics like sign ups, registrations, but are we creating value, are people engaging with our products, using them, potentially purchasing, whatever it may be. Eric Reeves defined the term innovation accounting in his book Lean Startup, and here we're saying that when we're in the early stage, traditional accounting methods just don't apply.
We may not even have revenue or financials that we can work with. So this is why we need analytics techniques such as cohort analysis. Cohort analysis is a technique for learning not just are we growing, but are we growing better, right? So very briefly, any metric that we could measure, say, for example, our percentage of active users, Any metric like this, when we're measuring it over our entire user base, we run into problems that we're trying to say, okay, we're rolling out new campaigns, new landing pages, new conversion funnels,
We want to see if we're getting better, not just if we're getting more users or more customers. When we measure it across our entire user base, those differences we may be making get drowned in the detail. So with cohort analysis, we very simply divide our users up into groups or cohorts, typically based on the month of sign up, right?
And then we can split out the users that we signed up more recently versus further in the past. And the patterns about whether or not we're making any improvement based on the changes we're making start to emerge. Super useful technique. Moving on to growth stage.
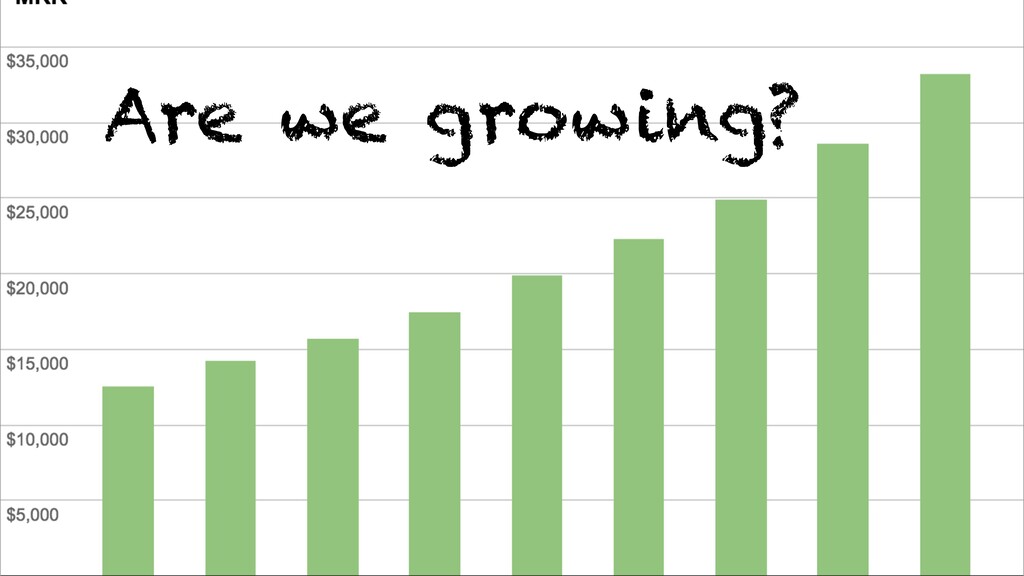
The questions are, you know, are we growing? Hopefully we have a chart that looks like the classic up and to the right. This is an example for a subscription business. And this is good. But any top level metric that we use, such as our monthly recurring revenue, our number of transactions, any high level metric only tells us the end result.
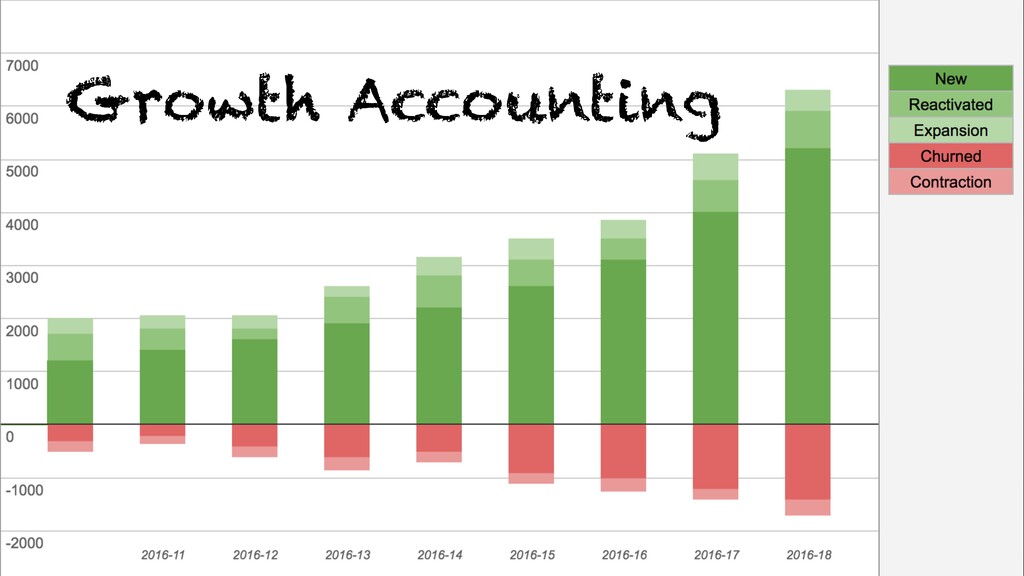
It doesn't tell us what's happening beneath the surface, which can hide very different pictures. Growth accounting is a super useful technique where we simply take the underlying components of any top level metric. In this case, take out our monthly recurring revenue for a subscription biz and say, what are the how much revenue came this month or this week from new customers that just signed up?
How much did we get from reactivated customers we won back who had previously lost? Did we get any expansion revenue from upgrades? We offset all this against what are we losing from churned customers or contraction from people that are downgrading their account? We really start to understand the health of this business.
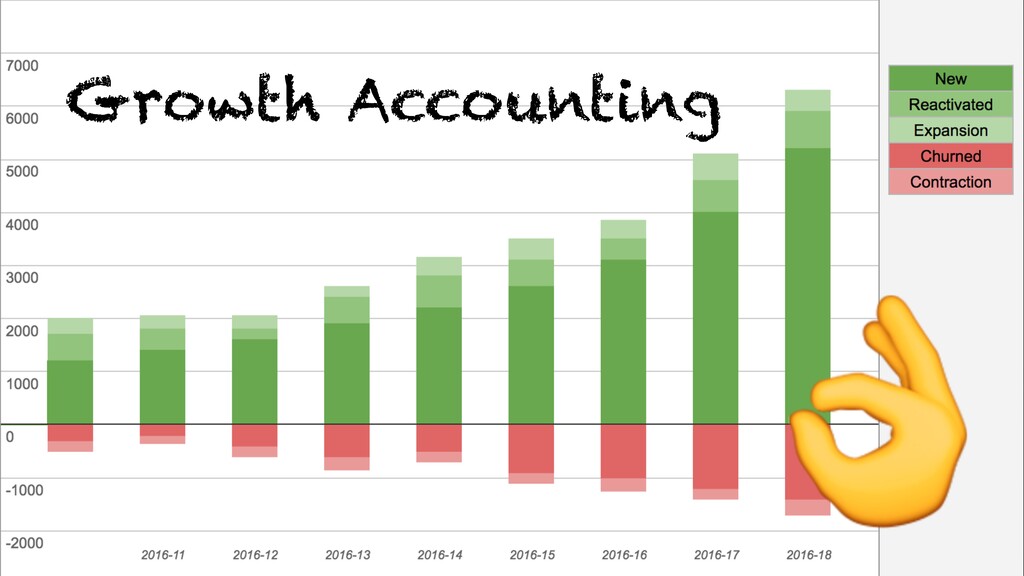
This is powerful because take the same curve, the same growth curve, right, the data that produces these two charts is the same. But this chart produces the same top level growth, and the picture for this business is very different. Here, we have huge amounts of churn, and we're only producing growth because our acquisition efforts are so successful that the acquisition is just beating out and offsetting our churn.
But this is an unhealthy business because as soon as the current customer acquisition efforts inevitably fall off or even fall, this business is going to be in a very bad state because everyone we're acquiring, we're losing very quickly. So growth accounting, a super useful method any time you have this top level metric.
The folks at Social Capital have an extended series of blog posts if you're interested in checking out more there. Other things for the growth stage are funnel performance. But for marketers, it's not just about conversion rates and what percentage reached each step of the sign up funnel, right?
As marketers, we should be thinking about the economics of the funnel. Our cost of acquisition, our cost of click, all the way through to what how much are people spending when they convert. So not just the conversion rate, but what's the basket size?
What plan are people upgrading for? Ultimately, what's the lifetime value of these customers? And this is key because as marketers, it's critical that we need to understand the full funnel. It's not good enough just to drop leads or new users or new sign ups, new registrations or even first time purchases on the business and then think job done, hand over to the product team or whoever else it may be.
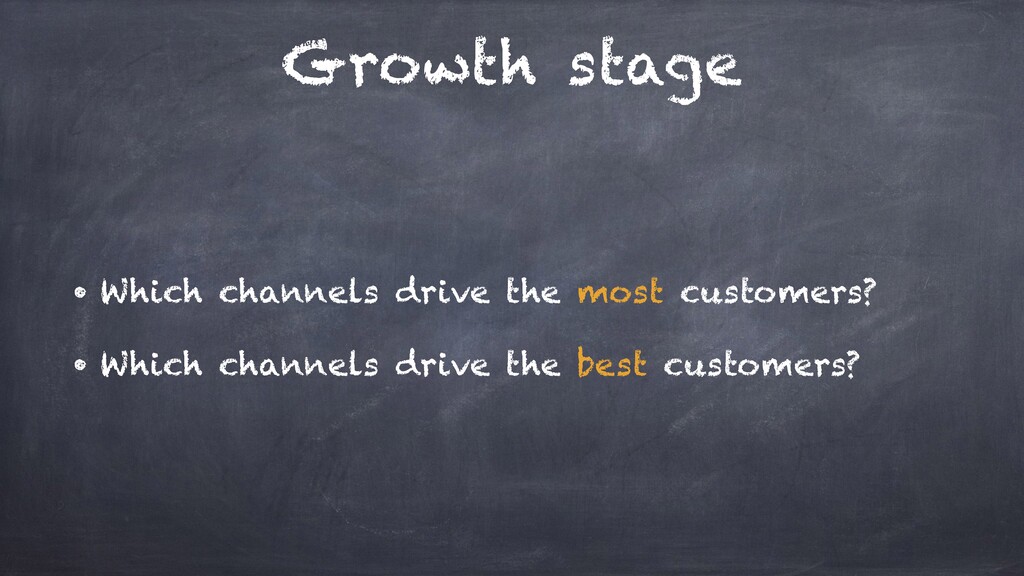
Thing here is that in the growth stage, actually, these are two questions that we ask every company we start working with at five hundred start ups. Think about this for yourself. Which channels bring you the most customers? Which channels bring you your best customers?
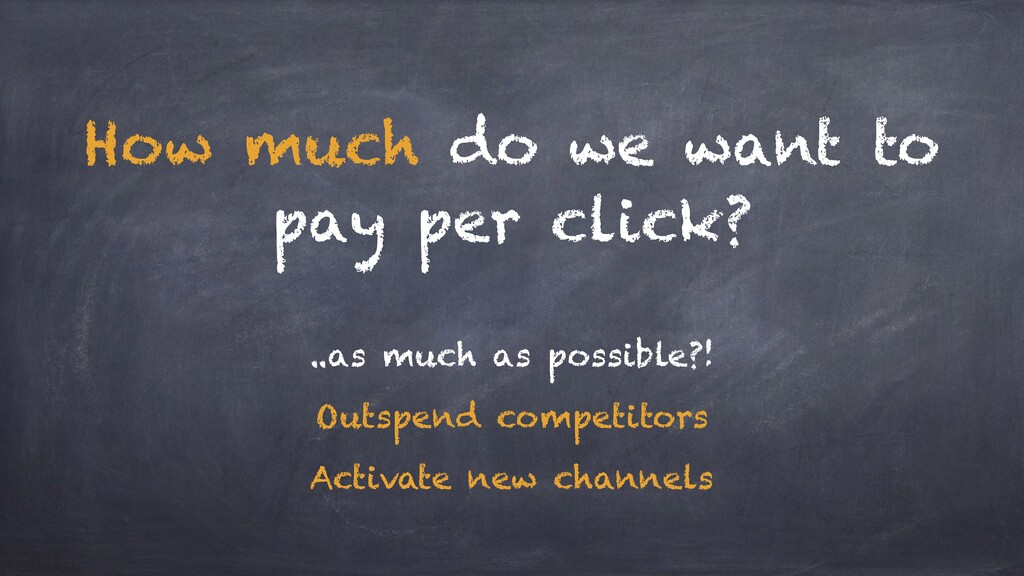
Oftentimes these are not the same. Here is a question. How much do we want to pay per click at the top of the funnel? Seems reasonable that we might want to pay as little as possible per click, optimise, drive down our cost. But think about it this way.
What if we try to pay as much as possible per click? Right? What would that give us? If we could pay as much as possible per click, we could outspend our competitors or we could perhaps scale into new acquisition channels that otherwise wouldn't have been accessible to us.
For sure, we want to grow in a scalable and profitable way, but as marketers, how should we be thinking about increasing the lifetime value, at least looking for those customers with high lifetime values and increasing conversion rates such as we can afford to spend more on acquiring a customer rather than less?
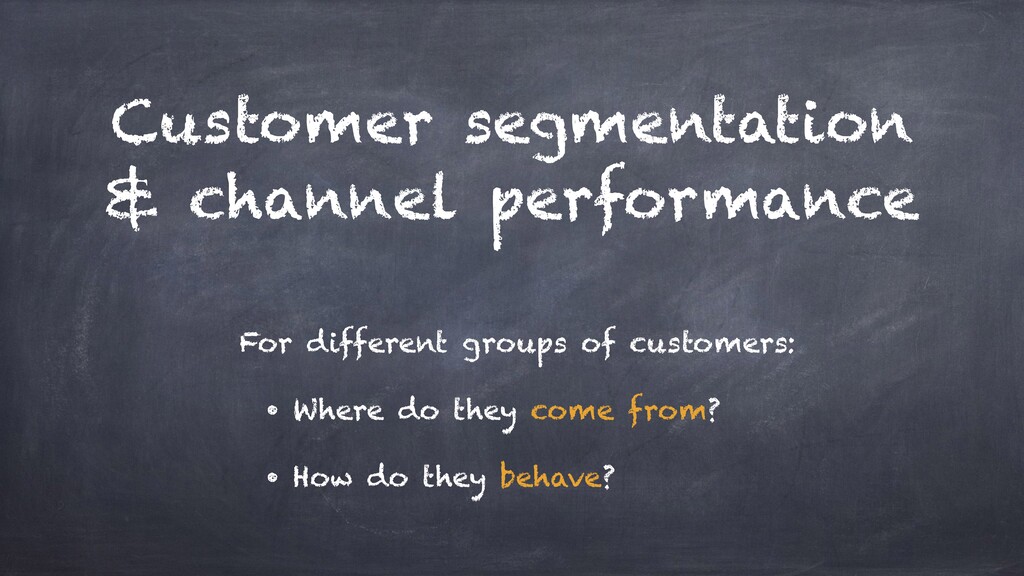
Interesting food for thought. This all comes down to customer segmentation and channel performance. Because it's very easy to look, and when we're just starting out, look at our performance in aggregate across our entire customer base. But for every company I've worked with, that hides a lot of interesting things beneath the surface.
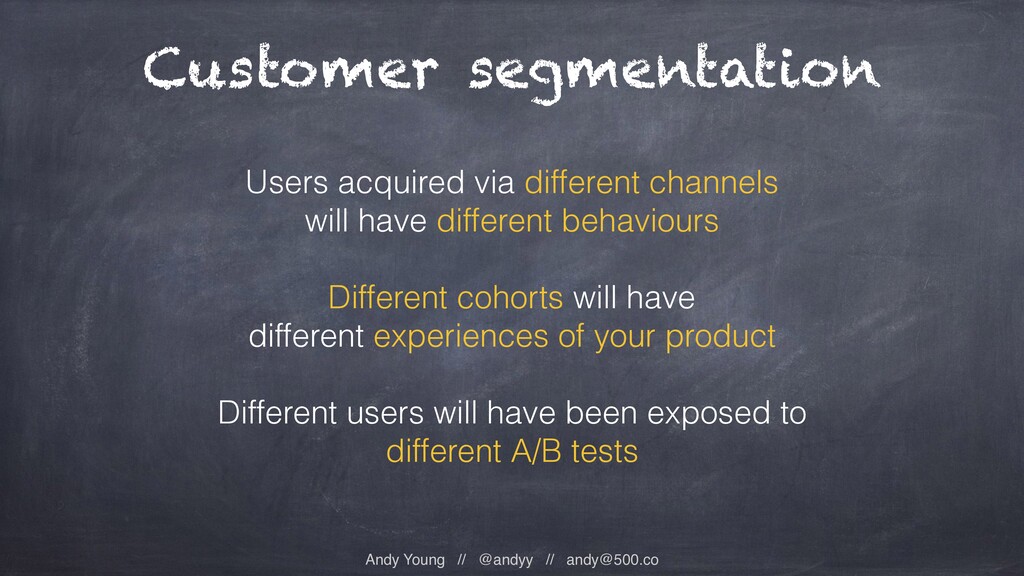
So for different groups of customers, where do they come from? Which channels? And how do they behave in terms of conversion rate spend? And thinking about segmentation here, users acquired via different channels inevitably have different behaviours. Conversion rates from Facebook, very different to referral, very different to organic oftentimes.
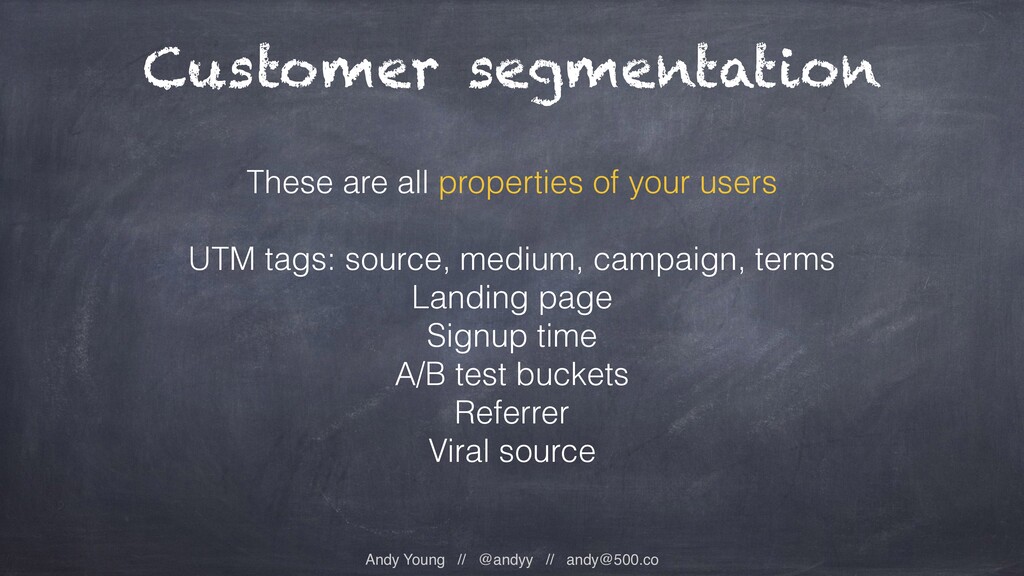
Different cohorts, people who have signed up for a product over time, will have experienced different versions of the product or of the website experience of the app. And maybe different users will hopefully have been exposed to different buckets of AB tests. So the key thing to this is these are all properties of our users.
And these are all things, our UTM tags, landing page, when did they sign up, what AB tests did they get to, that we should be ensuring that we store so that we can use these properties to slice and dice and segment our customers later to really understand these questions where our best customers are coming from.
One key obstacle that most every company I've worked with runs into is demystifying direct traffic, where we've done as much as we can to attribute, to tag our traffic and figure out where our customers are coming from, but still we get left with this large proportion of traffic that we just have no information and no insight.
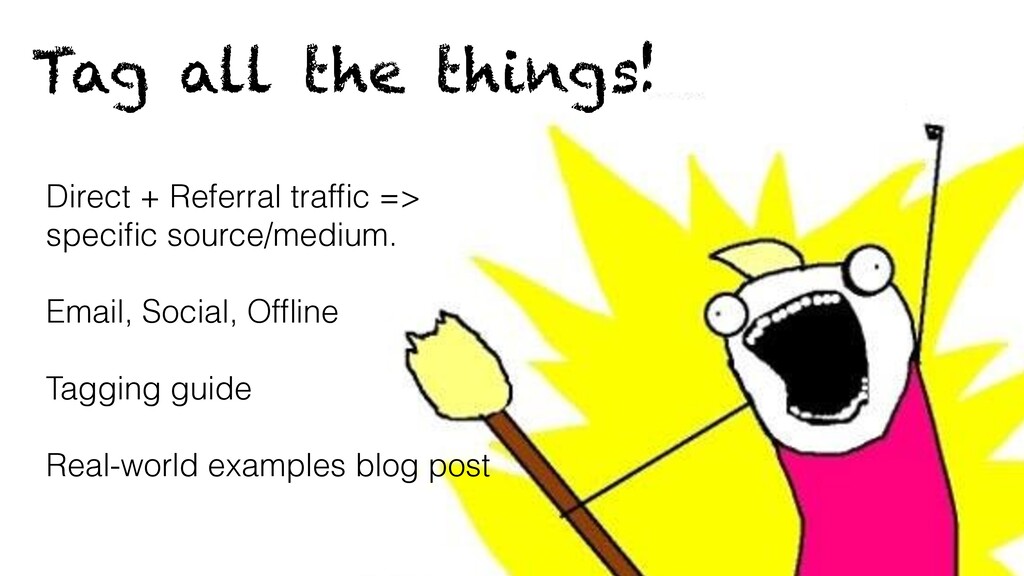
So I thought to briefly run through a few ideas and tactics here that have worked. Thinking about this, what do we do here? The first thing is just really simple. We have to tag everything. And typically, we'll have tagged our paid traffic, AdWords, Facebook, whatever it may be successfully.
But there's more we can do where our aim is to map all direct and referral traffic so that it shows up in our analytics tools with a specific source and medium. Do this for email, notifications from our own product, email marketing, organic social traffic, do we have that coming through and tagged appropriately?
What about off line? How can we identify traffic that's come from off line acquisition sources? There's a lot of detail here I'm not going to jump into, but I've published guide and reference to tagging, so the links are in the slides that you may find useful.
Once we tag the basics, another thing is landing page can often be a clue. Take this example. We've tried to tag as much traffic as we can, we still get loads of direct traffic, and if we drill down by landing page, we see a lot of traffic seems to be landing on the sign in or sign up address.
This is something I have seen a bunch of times when maybe we have social log in, so people sign up with Facebook or Twitter to use our site, and in doing so, they will get redirected away to Facebook or Twitter and then come back to our site.
Now, if the technology is not quite set up properly, this traffic can show up as a new fresh visitor the moment they come back to our site. So there's a clear clue there. Something else we see here is messages. This could be another clue if we're sending e mail notifications to our user base to come back to our application in order to read some message that they've received.
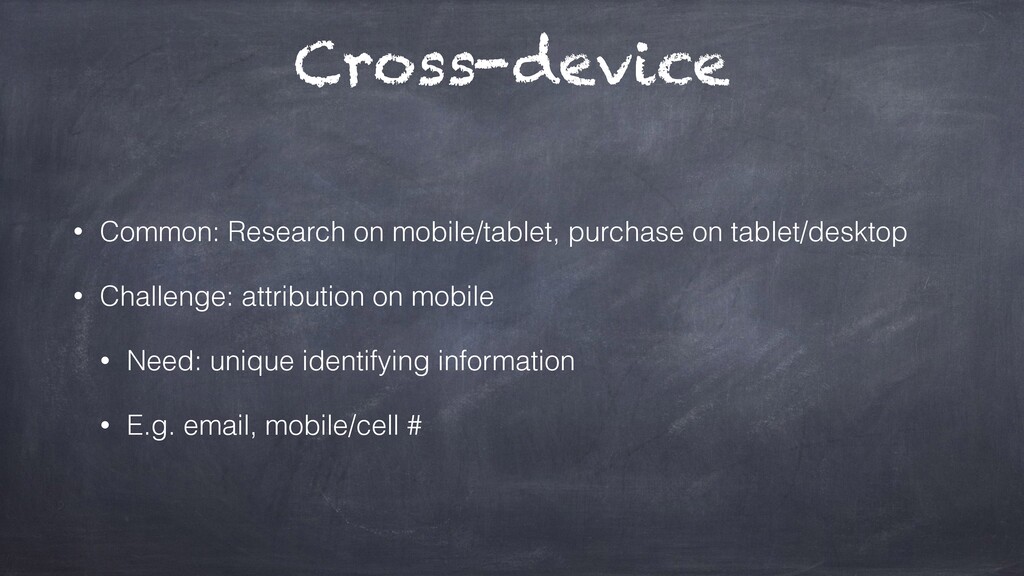
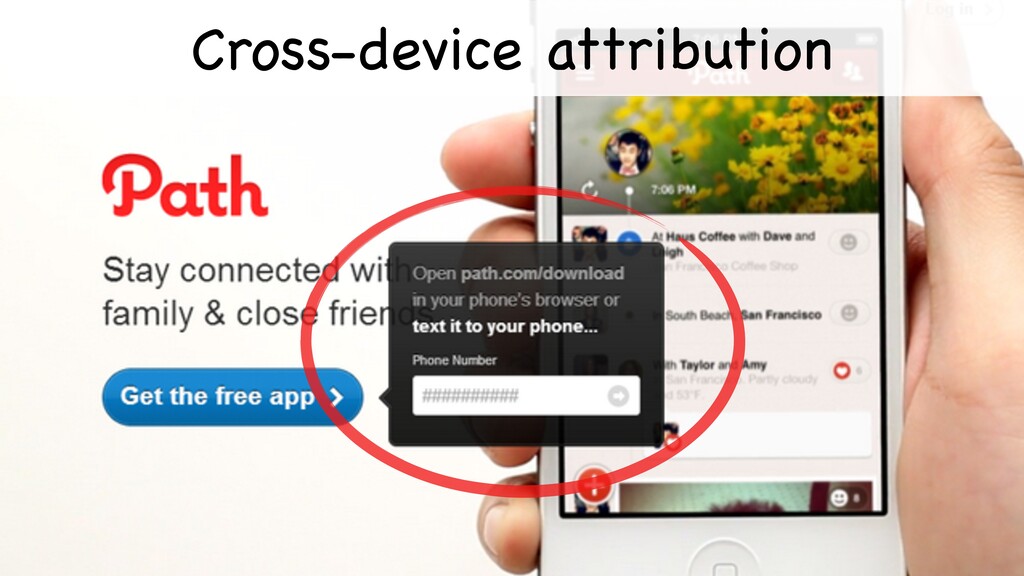
Maybe our e mails, our notification e mails don't have the appropriate tagging. So this can be a clue to what we might be missing. Thinking about other difficult questions, cross device offline channels. Cross device, it's a common and increasing problem that customers will often research and go through the consideration phase on one device, and then come back and purchase at a different time on a different device.
This is an unsolved problem for sure. It really is a best case effort. But thinking about it, if we were to solve it, what would we need? We just need to be able to join the dots, so any uniquely identifying information we can use to connect customers on different devices.
This doesn't need to be as heavyweight as trying to force people to create a log in on mobile, But ideas like if we could just prompt them for an email address or for a mobile number. Here's an example actually going the other way from path when you arrive on desktop but want to download a mobile app.
Here they use Twilio in order to say, hey, let's make it easy for you. Just enter your mobile number and we will send you a link to download the app directly. They can combine this with deep linking platforms such as branch in order to create a unique reference for that download link, so that when the user signs up on mobile with the same phone number, they can join those dots and complete that acquisition loop.
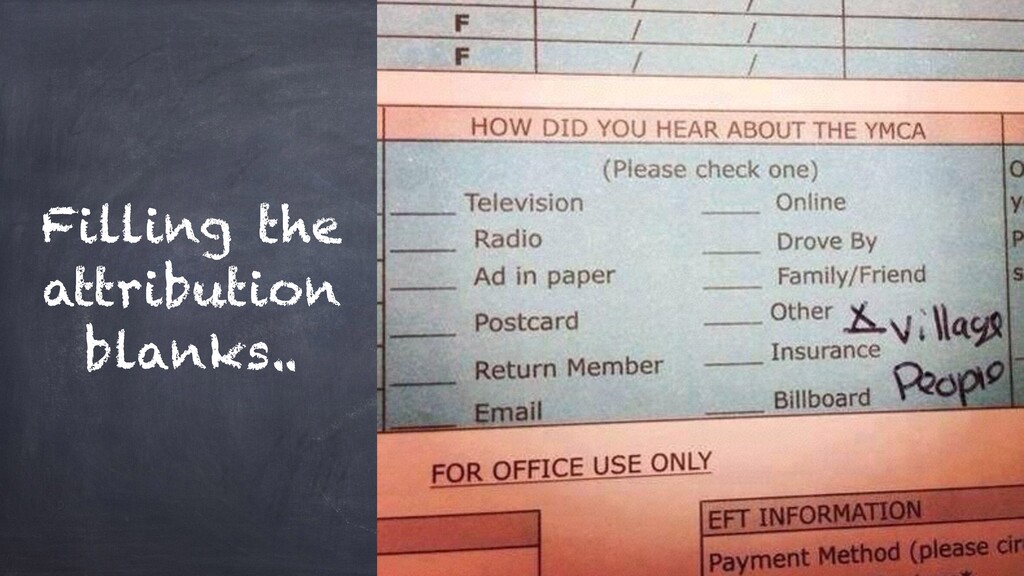
Another trick, filling the acquisition blanks, have you seen these sorts of surveys? Often forgotten or underused, Where we simply just ask our customer how they heard about us. So this could be super useful doing this after the customer has completed the conversion step.
So we don't want to do it up front. We don't want it during the funnel. So we don't want to get in the way of conversions. But say we've completed purchase, right? And like purchase completed screen, just ask the customer, how did you hear about us?
Make it optional, and we might get a percentage of people that fill this out. But that's okay. It's reasonable to extrapolate that out. And for any missing attribution, we can build up this picture of where people are hearing about us. Fantastic. Another thing, so getting pretty advanced, but geographic AB tests.
So, take Google as an example. You may have been exposed if you've been in London in the past couple of years. Google has been doing these broad brand advertising campaigns for, in this case, voice search for mobile, promoting Android. Also for Google Chrome, where they took over all the tube stations and wrappers around the free newspapers.
Google, of course, being data driven, I was really fascinated to hear how they tested this numerically, and what they did is they took London and looked at the baseline usage for Chrome, for example, in London, and compared against another similar city, in this case, I think it was in Germany, where they didn't run the advertising campaigns, and they can AB tested, if you like, monitoring performance over the subsequent weeks of usage of the product in order to see what impact that local advertising was having.
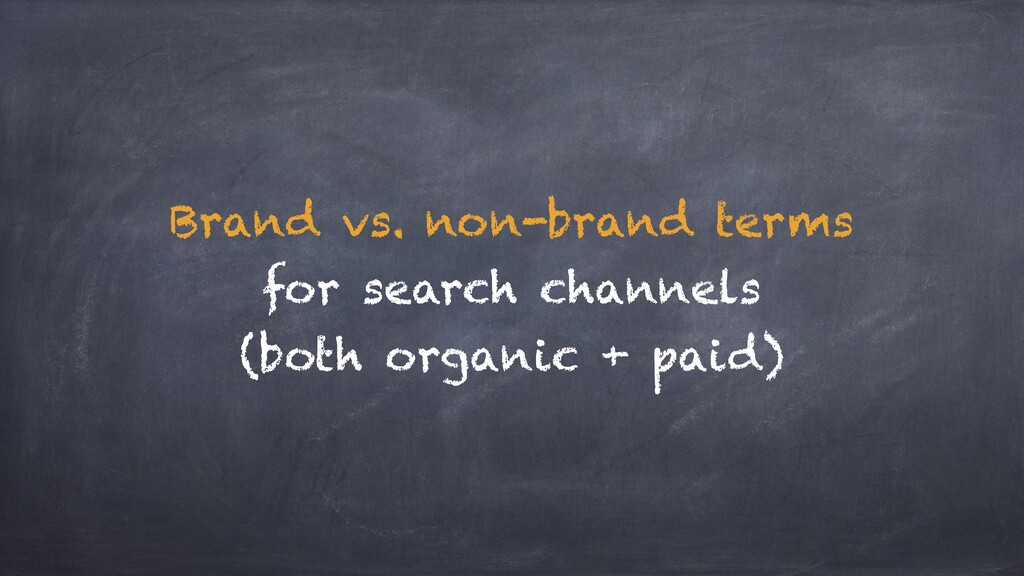
Moving on, so this is something that's really useful that comes up. Brand versus nonbrand terms for organic and paid search channels. So if we think about if people come to a search engine and they type in the name of our company, or if they type in a long tail keyword or phrase, Google by default and other analytics tools will typically bucket all these together under organic search, under paid search, separate from our direct traffic.
But if we think about it, what is the motivation, what is the context for someone who is typing our brand name into a search engine? They probably have more in common than with someone who is typing in our domain name and showing up direct than they do with someone coming via higher, more distant search intent via a longer tail search term.
One thing we can do here is make sure we're taking advantage of, in particular for Google Analytics, the advanced channel groupings, making sure we filled out all our brand terms, got those filters set up and set up these custom buckets so we're splitting out brand search from our organic search.
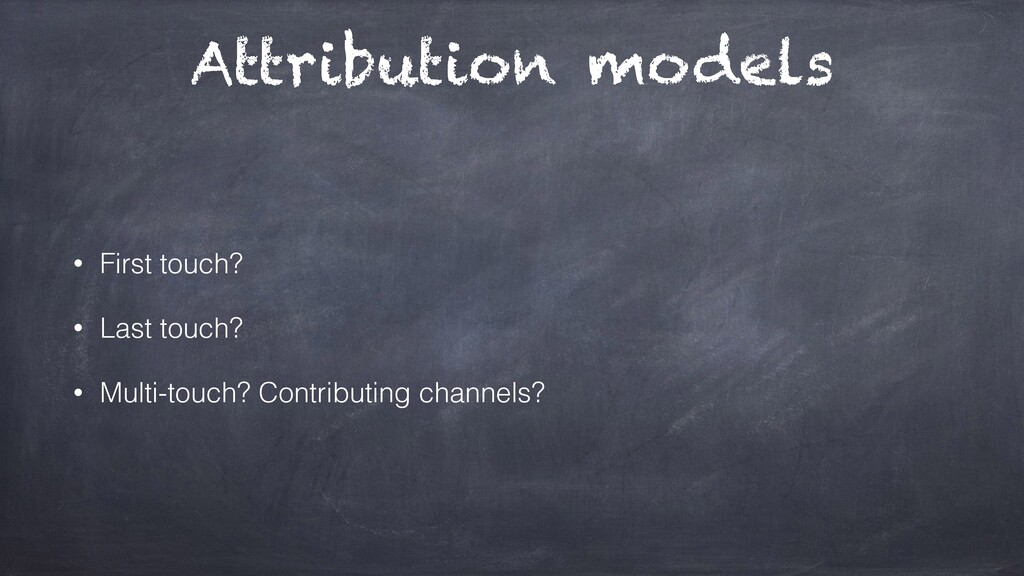
Typically, are very different behaviours. Attribution models. First click, last click, what about combinations? This is a pretty complex subject that oftentimes people get bogged down with. I thought it would be useful just to share one insight or one way I think about attribution in a growth context.
So if we think about how we can grow, right, we can grow in two ways our acquisition. We can reach more people or we can increase our conversion rate. So if we think about how we can grow that, our first touch channels, we need to know which channels those are because those are the channels through which we grow our audience reach.
This is where people first discover us. If we're trying to increase our reach, we need to be scaling first touch channels. Compare those with subsequent touches, subsequent clicks, last click, these help us grow our conversion rate for people that have already encountered us.
Oftentimes these channels will overlap, and for some businesses, may be an instant purchase decision and bounce or convert. But for me, just thinking about it in this way, how can we split out and identify these channels so we can think about it in terms of how we can grow, reach or conversion?
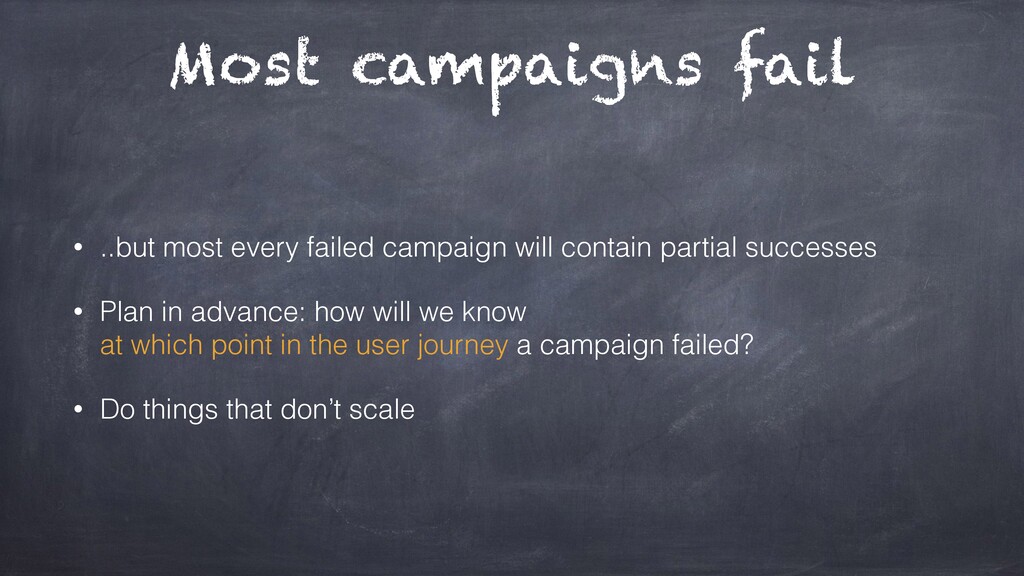
And then finally, in this section, a bit of a sobering thought that most marketing campaign experiments fail. And if they don't, if most experiments aren't failing, then probably we are not trying big, crazy enough stuff. So with a lot of the companies I worked with, the thing we found useful is realising that even within campaigns that fail, there's normally some kind of success within that.
So if we plan in advance, we need to ask the question, at what point in the user journey did the campaign fail? Maybe people didn't convert, but did they get exposed to the campaign at all? Did they come to the site? This is this cliche idea of doing things that don't scale, but was working with one company where they were experimenting with door drops, like flyers, like physical flyers delivered to a particular neighbourhood.
The first attempt, we had almost no conversions at all. It would be tempting to think that campaign failed. But what we thought about was, well, what point? So here we can do things that don't scale, like follow-up and knock on a few doors a week later and see if we can speak to people and did you pick up our flyer or did it get lost in the mess of, you know, stuff that you find on your doormat.
If people actually found that, was the design eye catching enough or do we need to iterate right at the first stage? Maybe people are picking up the flyer, are they coming to our website? If we plan in advance, what can we do to track that, including a particular short code or short URL that we can track?
So we say go to this address or search for this or whatever it may be. Or maybe doing, again, the geographic AB testing. So even within a campaign that fails, where can we learn what succeeds so we can come back and iterate? So, moving on.
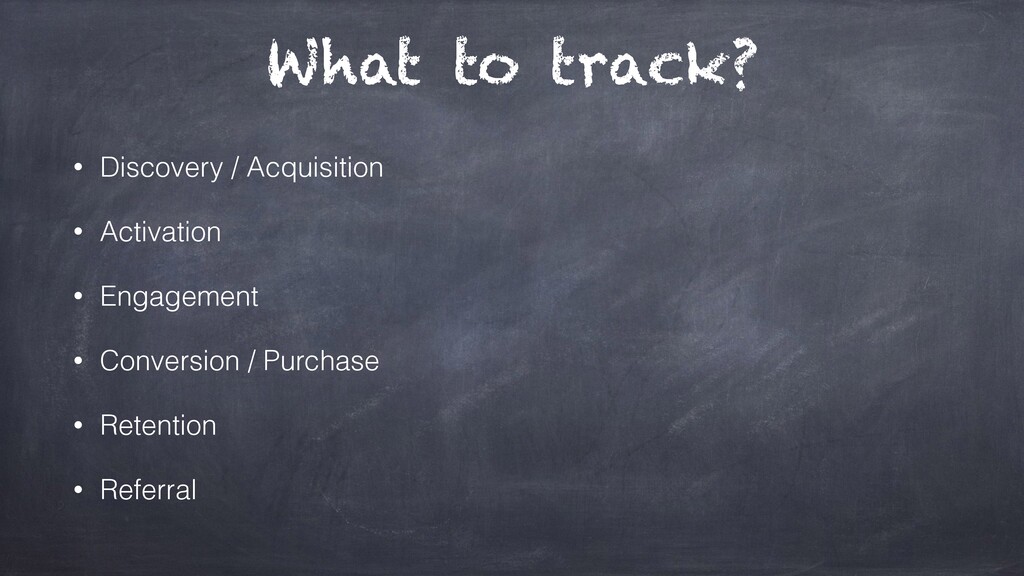
Diving into the analytics stack. So if we thought about the questions we want to answer, the sort of analysis we want to do, how do we collect this data? There's a lot of stuff we want to track, right from the top of the funnel through the activation engagement metrics and so on.
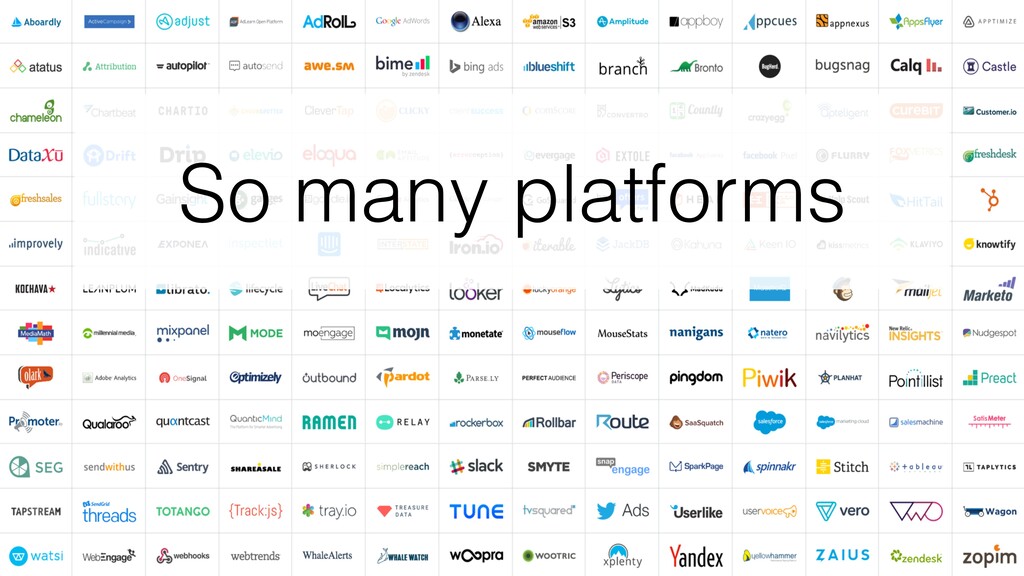
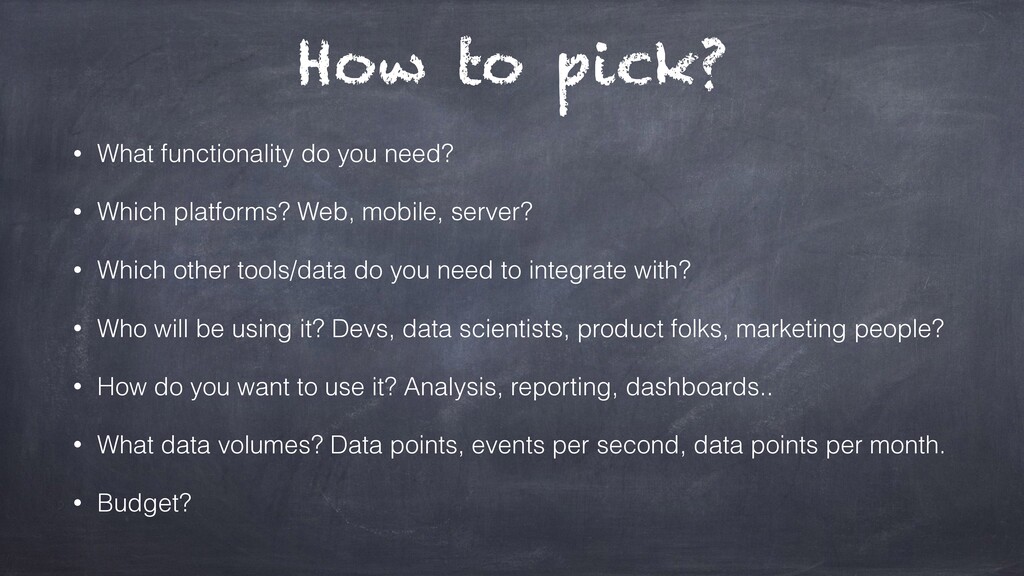
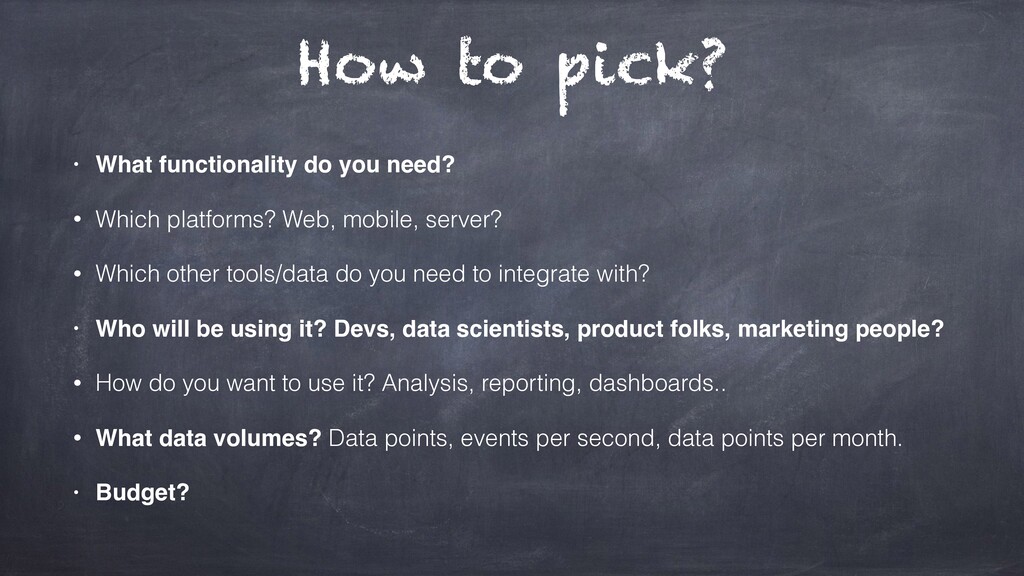
The thing is, in some ways, we're very fortunate that there are so many platforms out there now. But this gives the problem, how do we pick? And oftentimes people do struggle with this. So thinking about how to pick. The first question is really understanding what functionality we need.
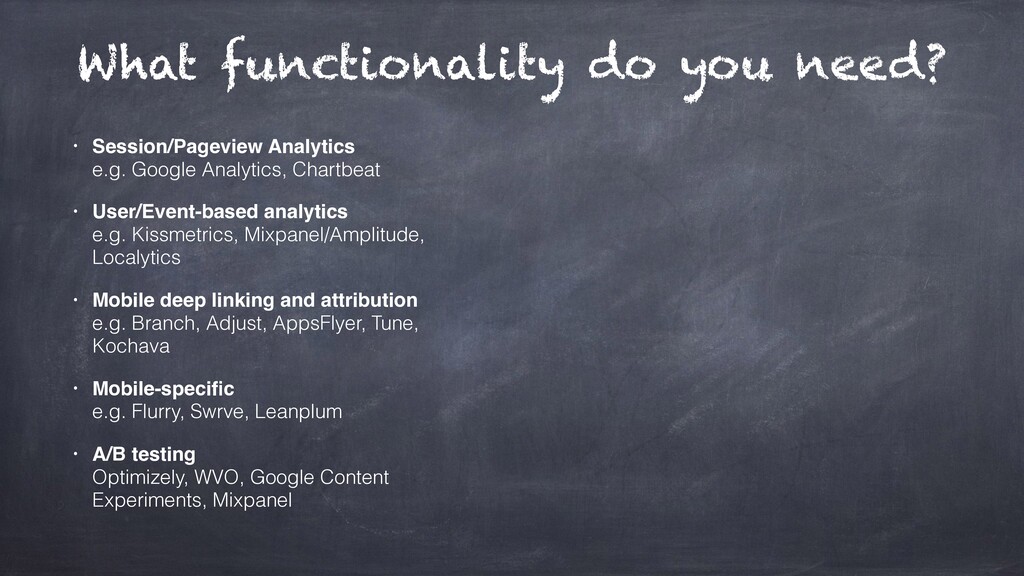
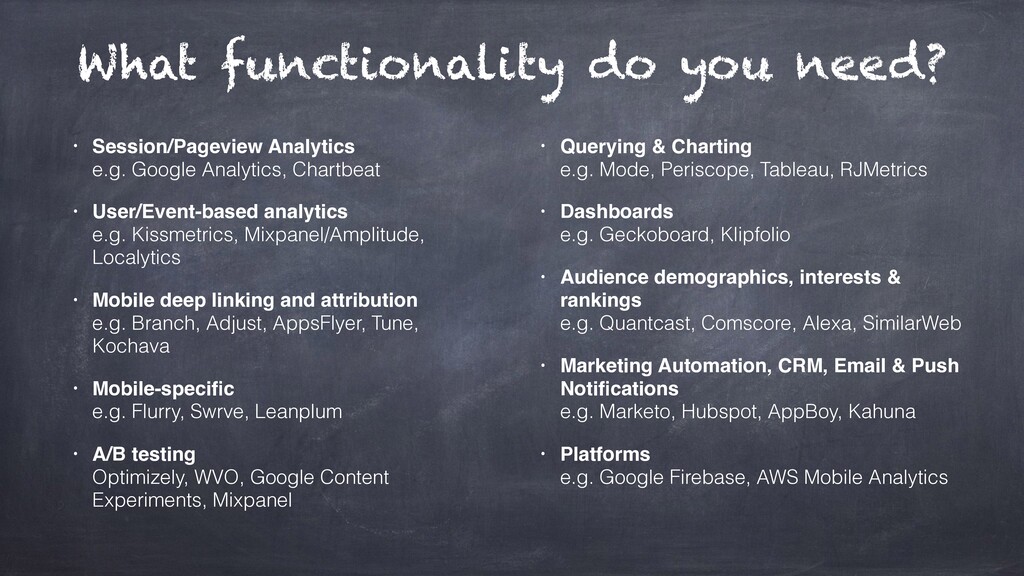
Because it's very easy, and I struggle with this, it's hard to keep up, getting confused about what functionality and features different platforms offer. There's a lot out there. We all start with Google Analytics for session page view analysis. Pretty much every company I work with, five hundred and beyond, goes beyond that to use some kind of user or event based analytics tool like mix panel, amplitude, and so on.
But there's more for mobile, I mentioned branch, deep linking, attribution, other mobile specific platforms, AB testing, querying and charting, dashboards, audience demographics, marketing automation, CRM, push notifications, and now there's platforms. It's very easy to think, goodness me, how do we even make sense of this?
So, I'm not going to belabor the point of going through every different scenario here, although I would love to chat with you about your individual businesses afterwards. But just for now, some thoughts around questions to ask yourselves when thinking what a good platform is for you.
So what functionality, but who will be using it? Is this for devs and data scientists? Or do we need platforms that products or marketing people are going to be familiar and fluent with? How do we want to use it? Is this for in-depth analysis or do we want some kind of reporting or dashboards?
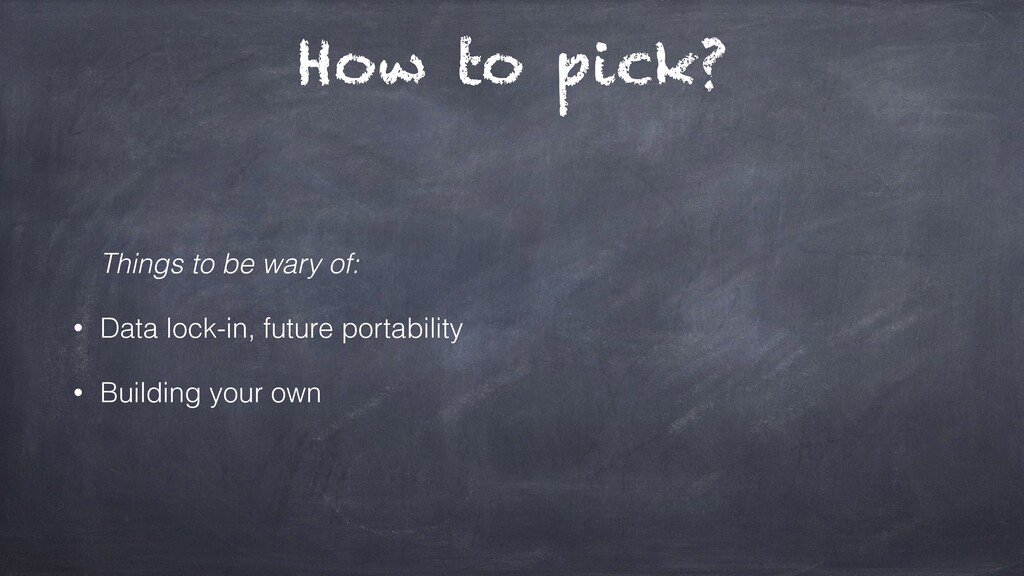
Which platforms? What do we need to integrate it with? And then what's our data volume? Right? And our budget? Things to be wary of data lock in, future portability. It is useful to be able to switch and choose these over time. And, also, oftentimes, particularly when we're working developers, and hands up, I am one, people think, oh, we can just build our own.
I have yet to work with a company where the right answer was to build their own analytics and reporting stack. But all these tools, and they're fantastic tools out there, but they're not a panacea. The perfect tooling will not bring us success. In fact, it's often better to just pick one or two tools, honestly, and get set up and running than try and obsess over what's the best tooling set up.
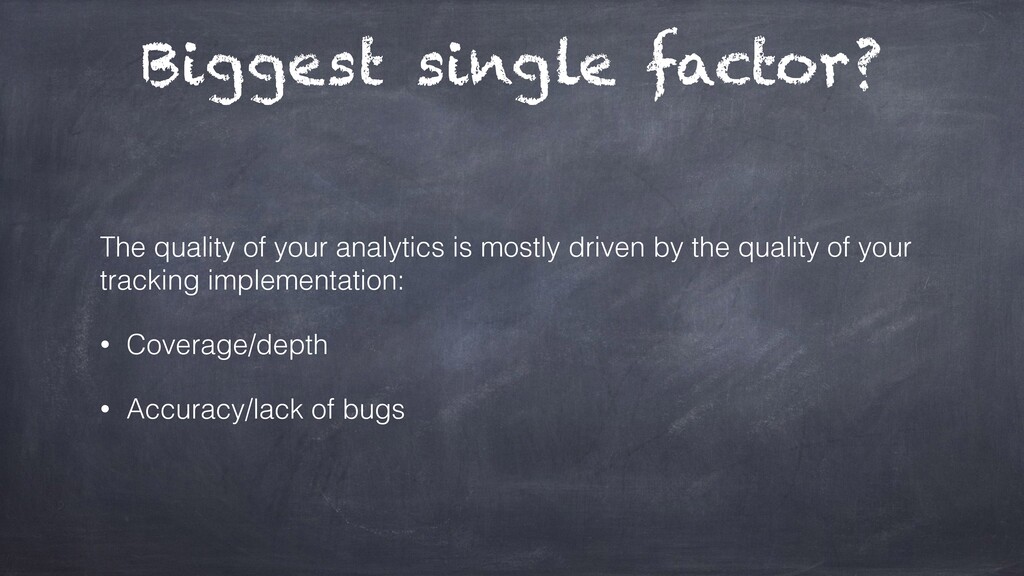
Really, you don't need to worry about it. The biggest single factor I found that affects the quality of analytics, the companies I work with, is actually the quality of their tracking implementation. So if you're going to worry about anything at all, worry about this.
When we're implementing our tracking, like every company I've worked with has struggled with the coverage or depth at some point when they're not tracking the information they need, thinking back to that attribution. Or the accuracy, and, like, I've been through so many cycles of discovering bugs and things that I've implemented myself.
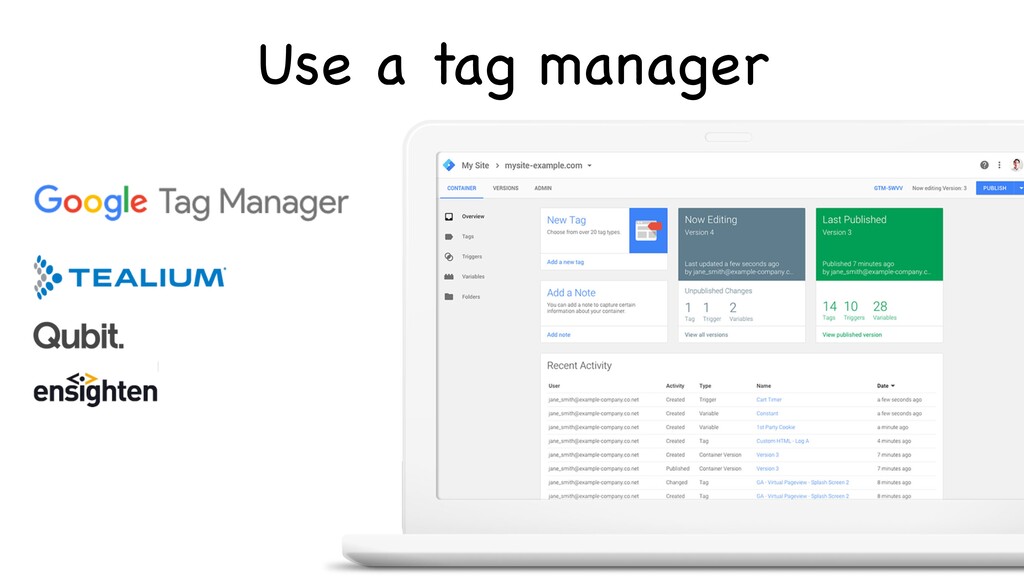
Right? So, very quickly, in order to deal with this, use a tag manager. Google tag manager is fantastic and free if you're not using it. Or, if you choose, you can pay vast amounts of money for enterprise solutions to do the same thing.
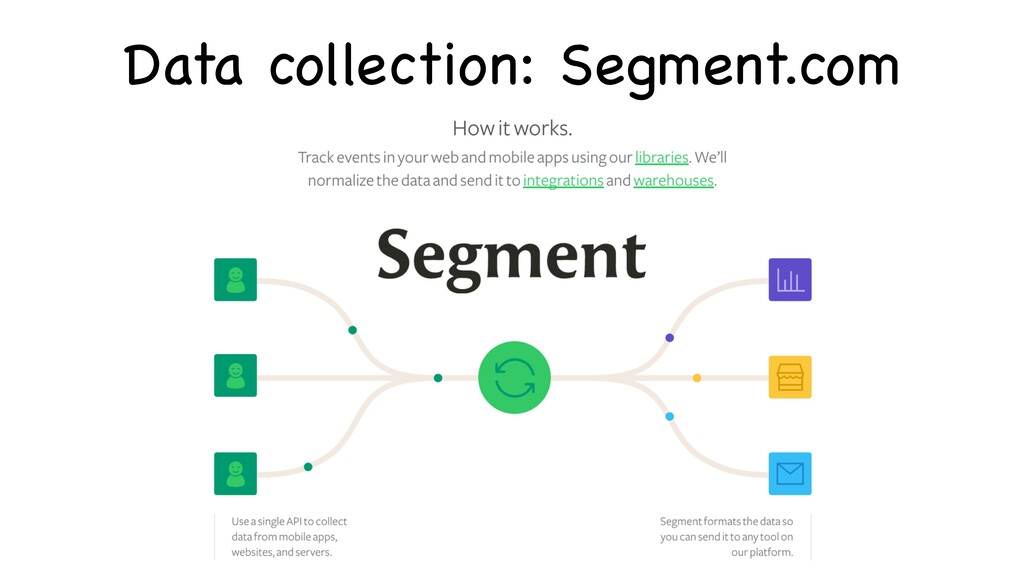
Data collection, segment dot com, if you haven't seen that already, really useful tool. Makes it easy to implement a single API for our event tracking, and then gives us the power to plug, turn on and off different analytics and data tools, both sources and analytics platforms with a couple of clicks.
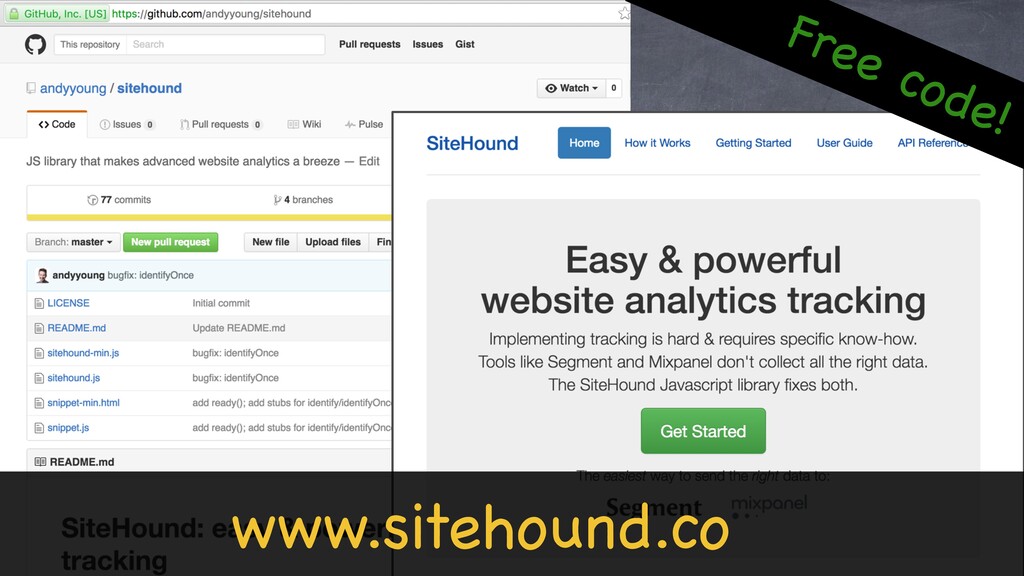
That's incredibly useful. Free code. I've actually produced an open source JavaScript library that sits on top of segments that I've used with a number of companies that adds a lot of the attribution and marketing data on top. Whether you use this or not, you may find it useful to take a look.
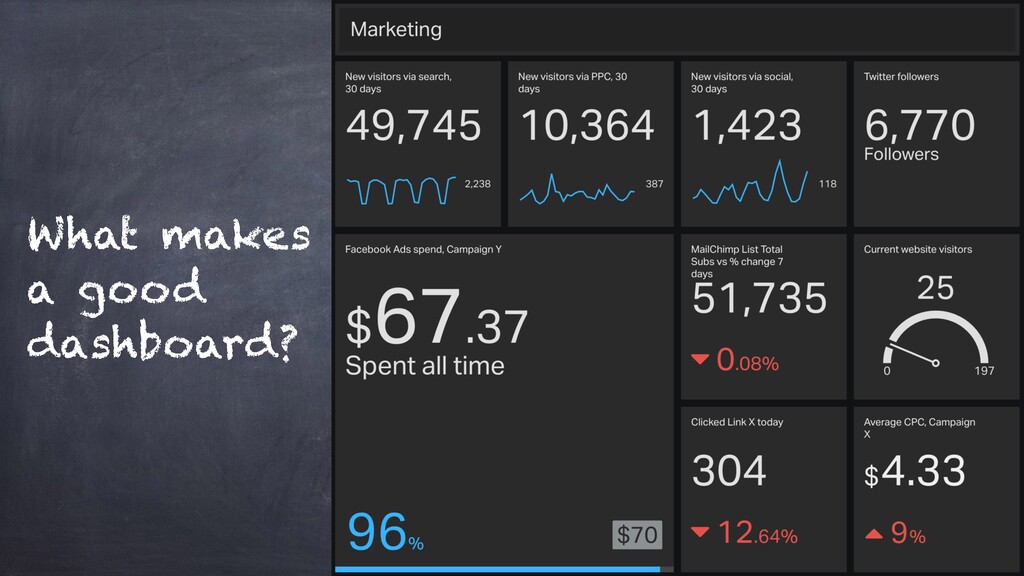
When we have got all this data, we have collected everything. A quick thought around dashboards. What makes a good dashboard? Here's an example from the folks at Gecko Board, their example marketing dashboard. Again, a pattern I've seen a lot. People think, okay, that's great.
Let's put up a screen in the office and let's display some numbers up there. This may be good for you, particularly if you're currently working in an environment where it's hard to get visibility, but the typical pattern I've seen is that people set these screens up and then just never look at them.
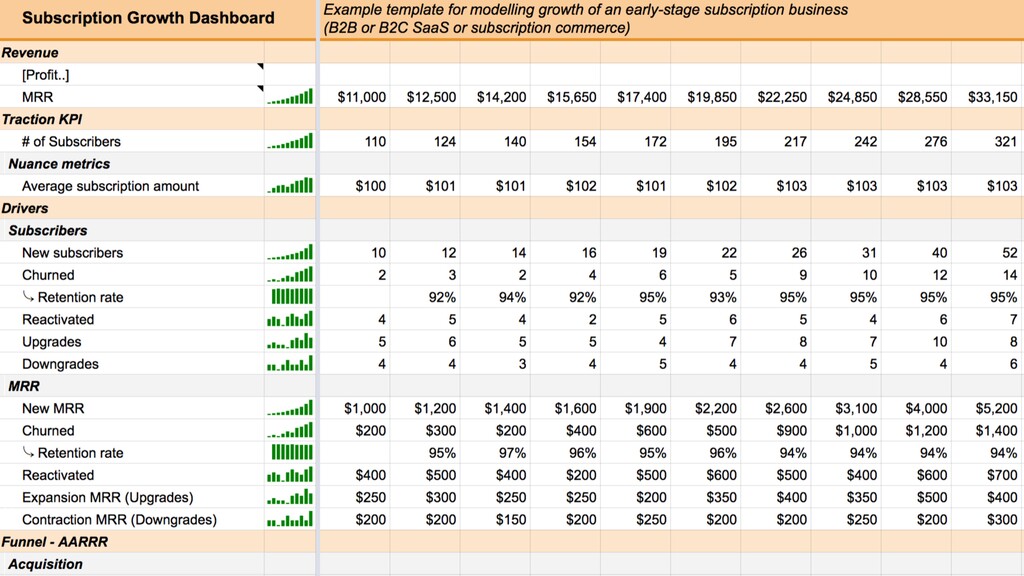
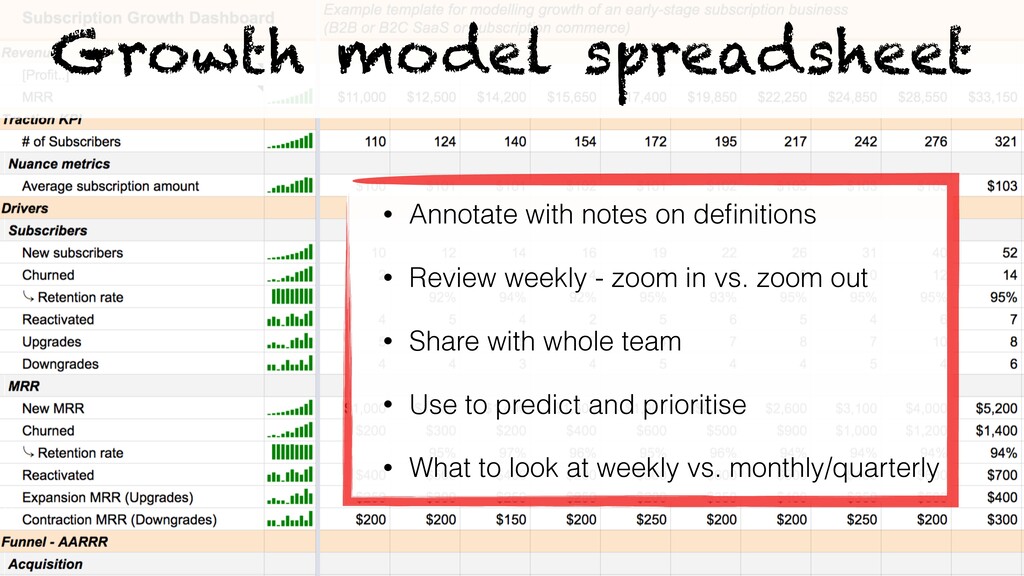
So the types of dashboards that I found most useful, I spent time when I first started working with a company, don't get too excited now, is the humble spreadsheet. Very simple. This is an example growth spread dashboard for a subscription business. We have columns along the top for typically a weekly cycle works well.
And then rows down the left hand side for the different metrics, starting with what's most important, what are we trying to produce, and then the inputs to that. I actually have an example. This Google Sheet is available at the Bitly link, if it's useful to you.
What can we do with this? This is an incredibly useful tool to set that weekly cycle, so when we've zoomed out from the day to day optimising campaigns, designing experiments, and say how are we tracking? Are we making progress? How are our conversion rates doing?
Our overall costs? By sharing this with the whole team, everyone can get context on how their part fits into the big picture. We can use this to predict and prioritise, like, our conversion rate is doing just fine right now, so we should be focusing on channels.
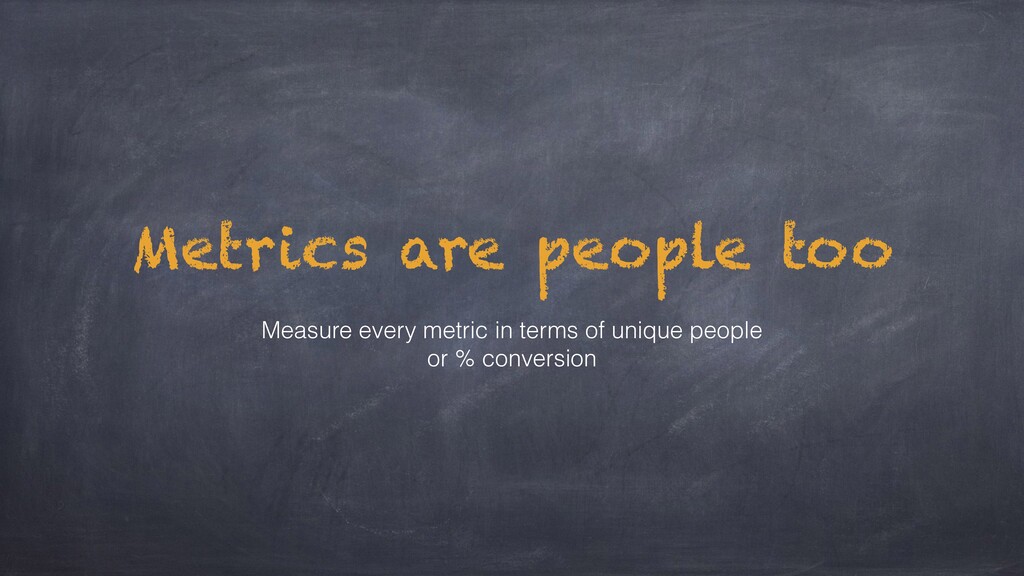
Or if our conversion rate has plummeted, we should have the visibility so we can dive in and address that. And think about what numbers we should be reviewing on a daily cycle for individual campaign, admin, versus weekly, versus perhaps monthly or quarterly. Key thing for all the numbers that go here, metrics are people too.
Every metric should measured in terms of either unique people or a percentage conversion rate of those unique people. So when we get the inputs about various clicks, what really matters is how many people got there eventually. So thinking about joining the dots, putting these together, how do we produce these sorts of dashboards?
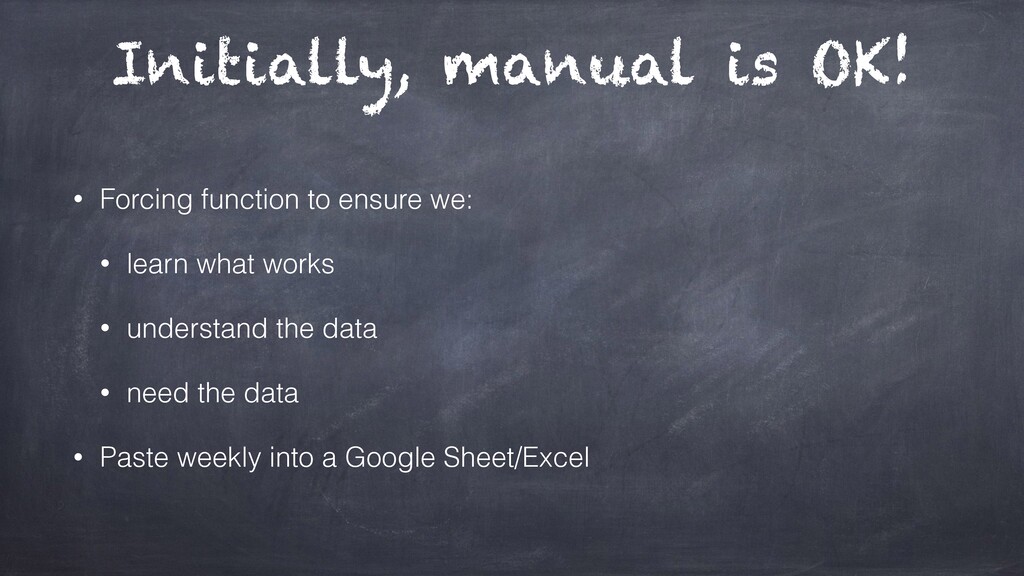
Initially, manual is okay. Like, people rush to automate, but by starting manually and filling out that spreadsheet, it's actually a useful forcing function. So we just learn what works for us, like what numbers make sense. We can understand the data and make sure that we're not working off incorrect calculations if we're calculating them every week.
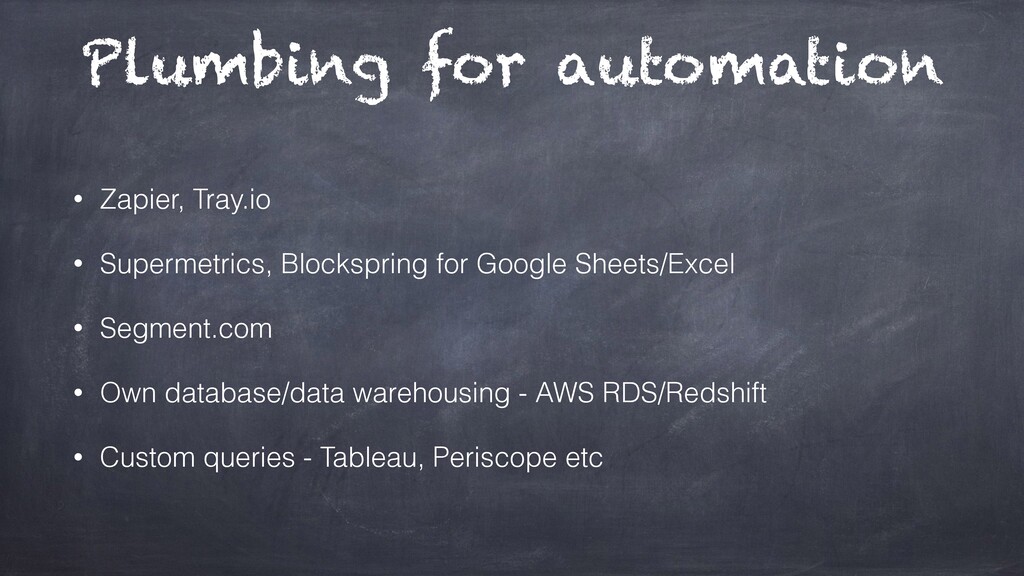
Make sure we figure out what data we need when we fill it in. Only over time can we start automating to reduce effort when we found something that works for us. We come to automate, there's loads of plumbing tools like Zapier or Tray are fantastic, super metrics or blocks bring to pull any data imaginable from Google Analytics, many other platforms into a spreadsheet.
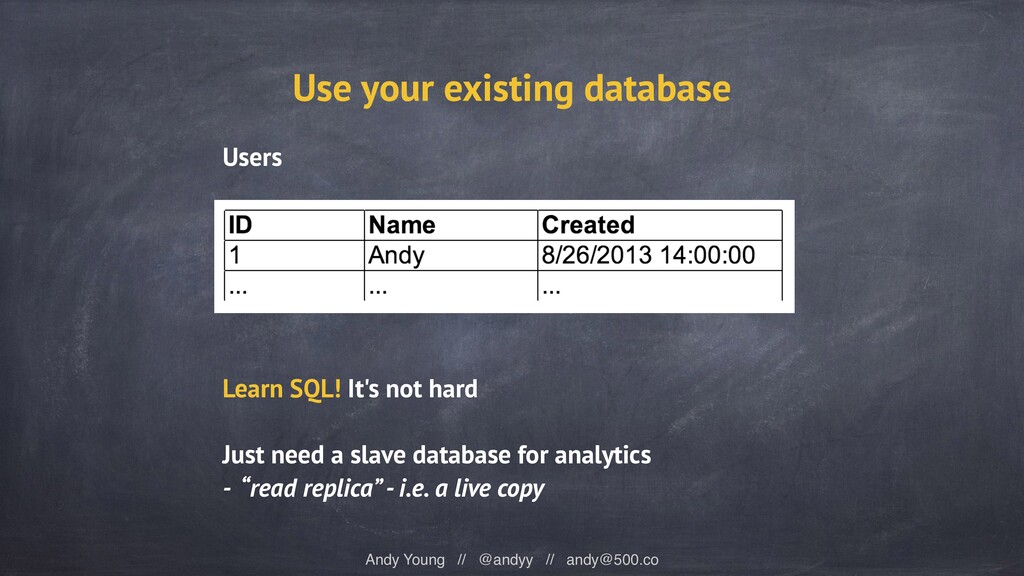
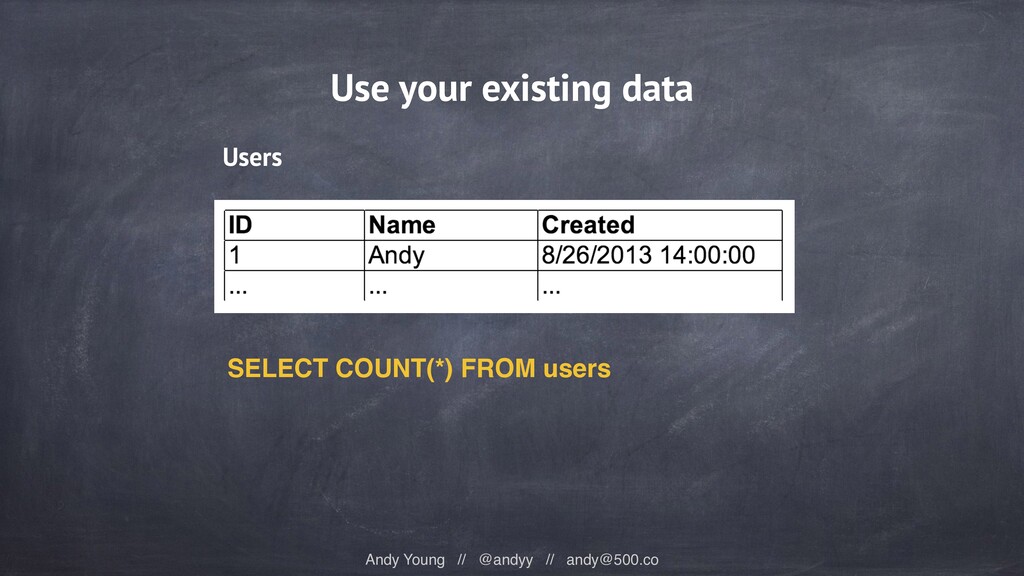
Segment, already mentioned, and then finally on to our own data base or reporting and perhaps using BI tools such as Tableau, Periscope, etcetera. Cool. So, we've talked about why analytics, what questions we want to answer. We have talked about how to collect the data, what sort of platforms and tools are out there.
So finally, when all this hits the real world. Now, some of you may relate. At least in my personal experience, the numbers never add up. What I would like to conclude is by sharing with you what I might call the five stages of analytics grief.
So follow along with me and see how familiar this is. The first stage of analytics grief I think about is denial. This is where we are all happy, are set up, we have got our tooling and platforms in place, and we are like, yep, are using this data and it's great, fantastic, everything is working, brilliant.
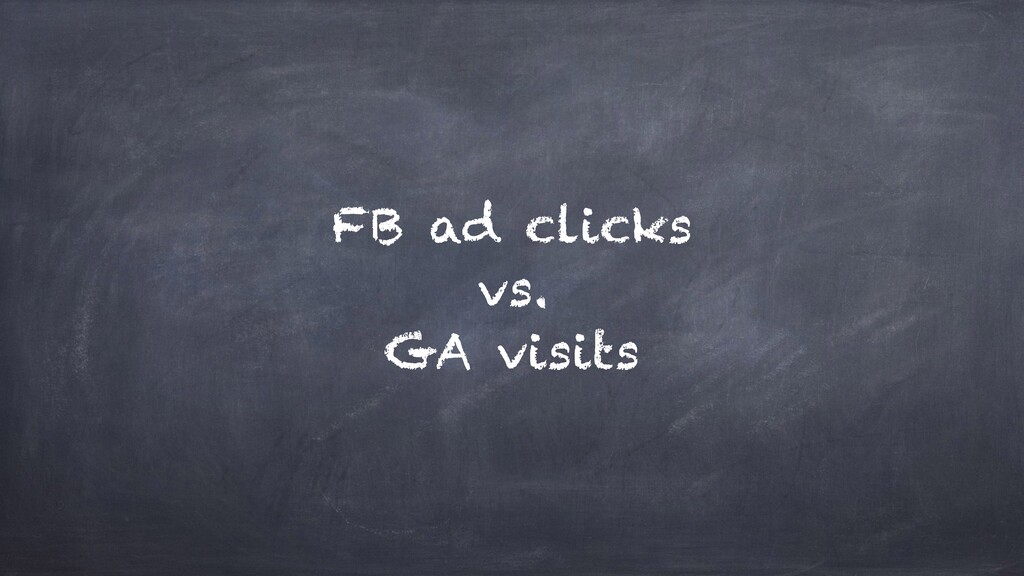
And then we notice that the clicks in our Facebook ad reporting dashboards aren't matching up with the number of visitors that we are getting inside Google Analytics. All right. We start digging around, so the next stage we enter in Analytics grief becomes anger.
Why doesn't this make sense? I stared at the data for an hour. The next thing we look at is comparing Mixpanel versus our own database. This is a project I was working on last month where we're measuring people that completed a set in the sign up funnel.
It's the same data being measured in two different places. Why is Mixpanel undercounting by five or six percent? This makes no sense at all. It's so frustrating. The next stage we enter is bargaining. This is, I think, where we start clicking around wildly within our analytics tools, trying to find some way to make the data add up.
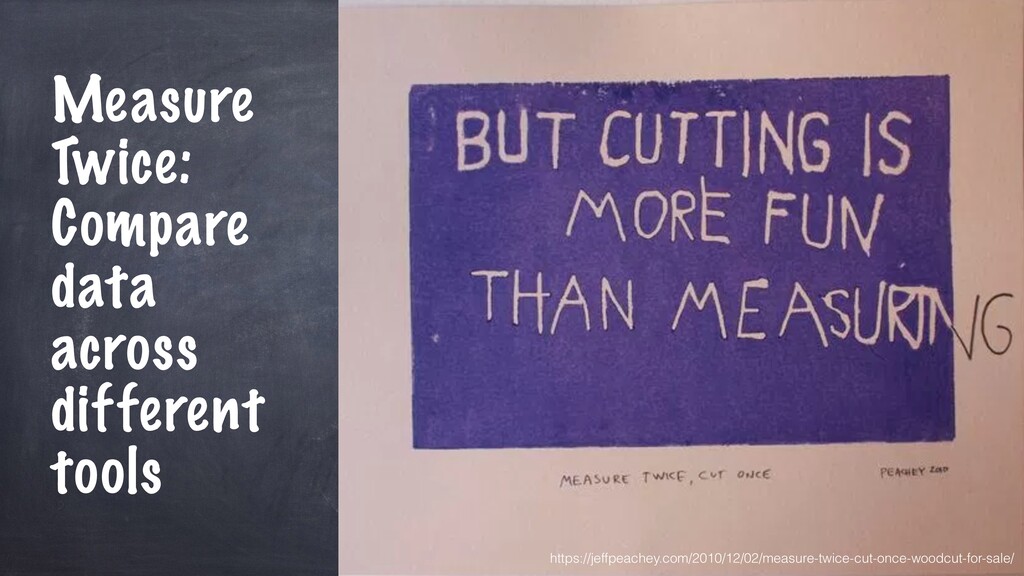
I change the filters or change a different tool and to find some way for this to make sense. There's a really useful point here in that by comparing the same measurements across different platforms, typically like Google Analytics or Mixpanel, so different types of measurement tools, be a really useful way to sanity check whether our instrumentation is correct and whether we have any issues or not.
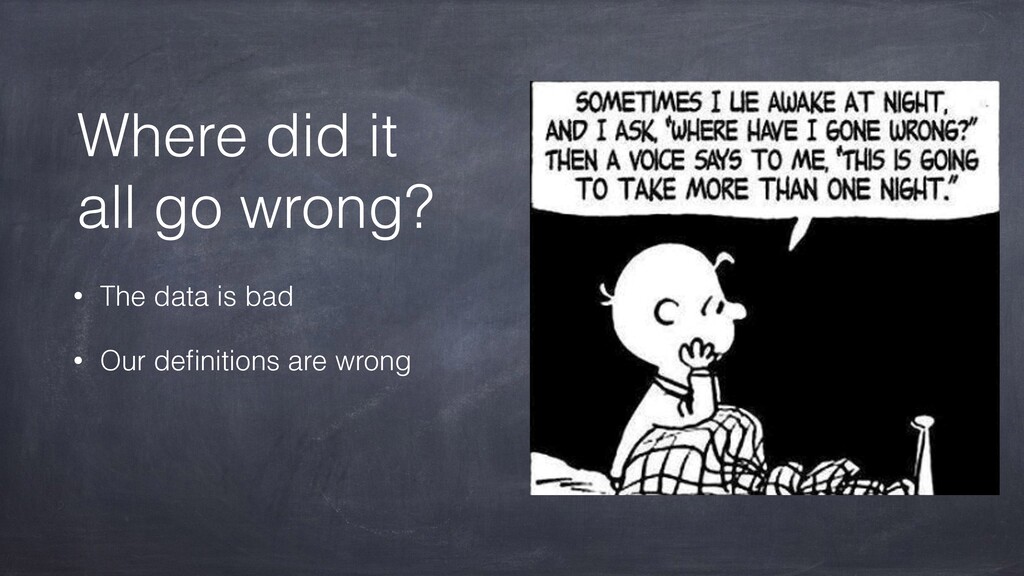
But then, finally, it does get a bit depressing, and we sort of start the question, where did it all go wrong? But it's at this point that we hit the bottom and we start discovering perhaps some light at the end of the tunnel.
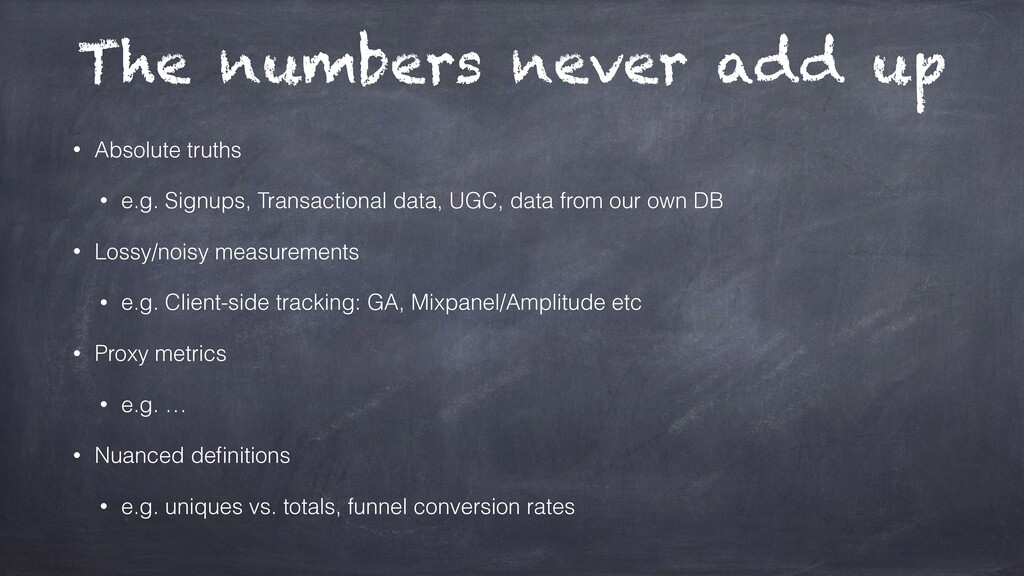
If we think about where it all went wrong, how our numbers don't add up, there's two possibilities. One is our data is bad. We've talked about, touched on whether we should be looking into our analytics tracking for errors, bugs, whatever. The other is maybe our definitions are wrong or we're misunderstanding what definitions we're using.
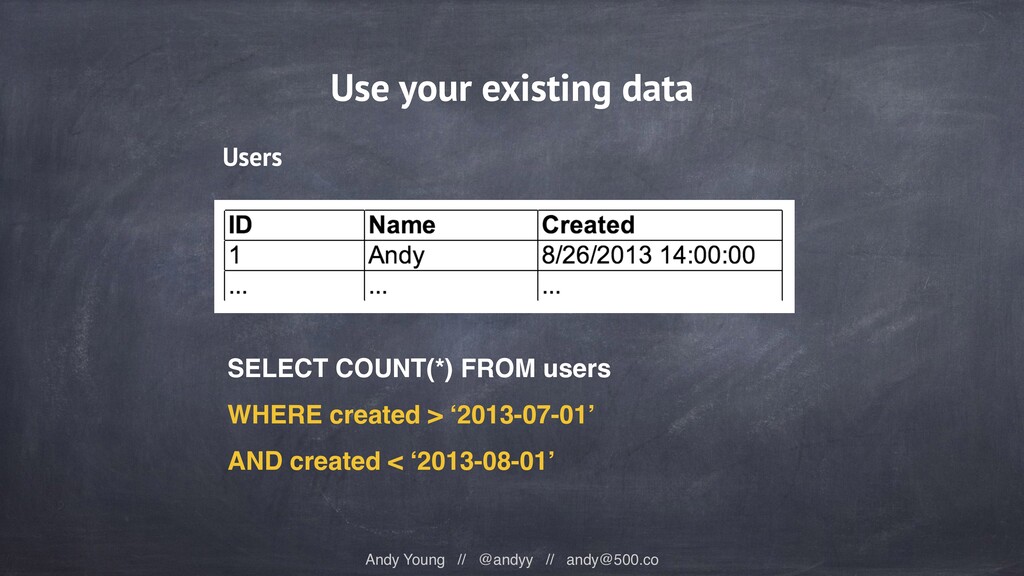
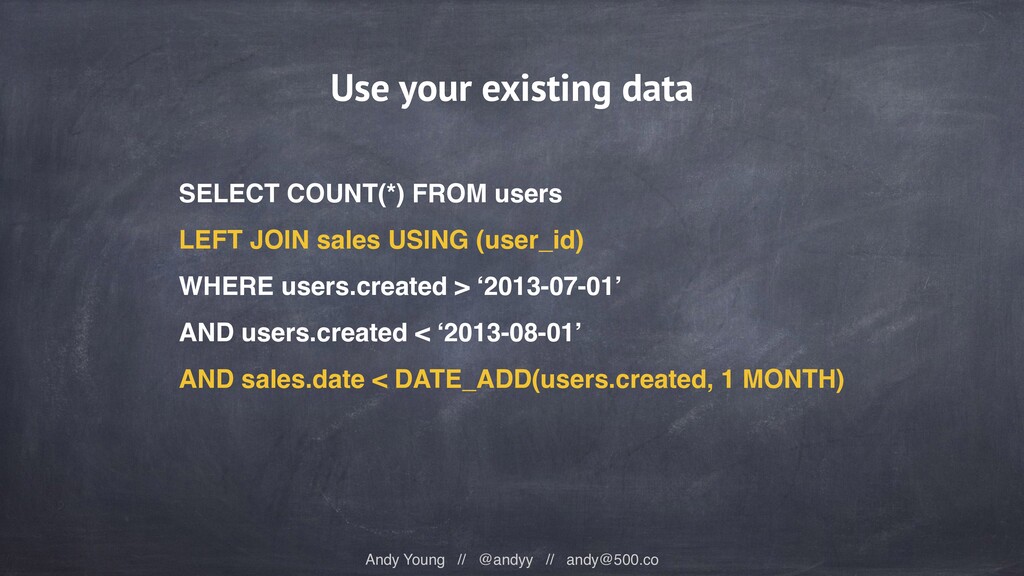
Maybe we think the data means something, but it actually means something else. These are kind of the only two possibilities. If we dive into these, we'll be able to find some absolute truths. Typically, where the data is in our own database, so like sign ups, transactional data.
We know how many purchases we had, we know how many pieces of content have been reported. Compared to that, we have data that's inherently lossy or noisy, anything measured from the client side by these tracking tools, right? GA, Mixpanel, etcetera. Thinking about the definitions, there's a lot of nuance in there.
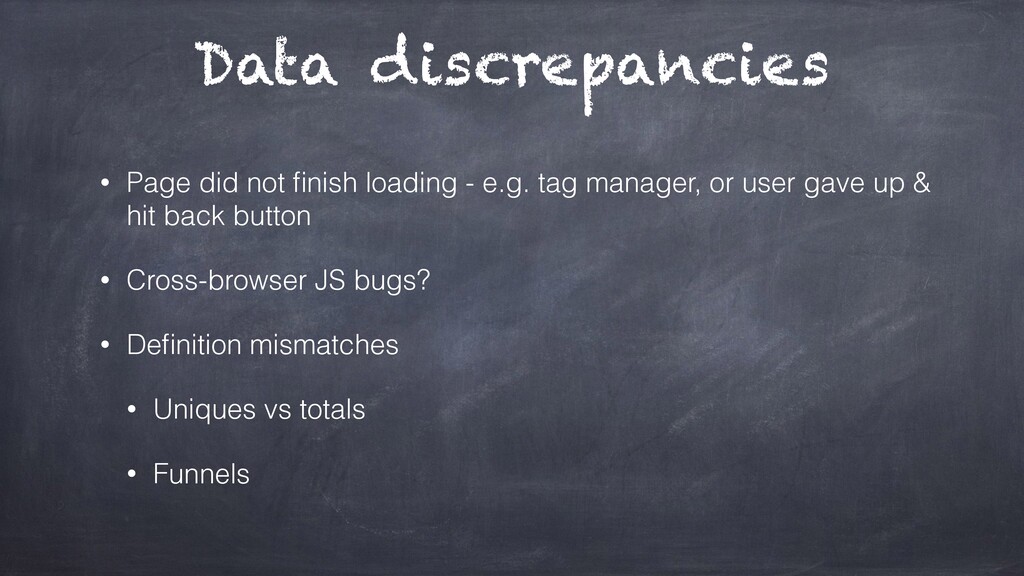
Uniques versus totals often trips us up. About funnels, we're looking at conversion rates, but what happens if someone enters the funnel part way through? How are they showing up in the data? Do we really understand these numbers in front of us, how they've been collected and what they mean?
Here's the thing. Even if the numbers do add up, they're often still misleading. This is my own personal experience. So in the latter days of my start up group spaces, as we couldn't make it commercially successful and I was scaling it back down, we ended up turning off AdWords.
Now, we had AdWords tracking running perfectly. We saw how many sign ups we were getting from AdWords every day, and we turned it off. And you know what happened to our overall sign ups when we turned off AdWords as a main channel? Almost nothing.
So all these people that I had accurately tracked as attributed to AdWords, it turned out that they were gonna find us anyway. And that for me was a very sobering experience. So what do we take away from this? Experimentation. Always looking to dig within the data.
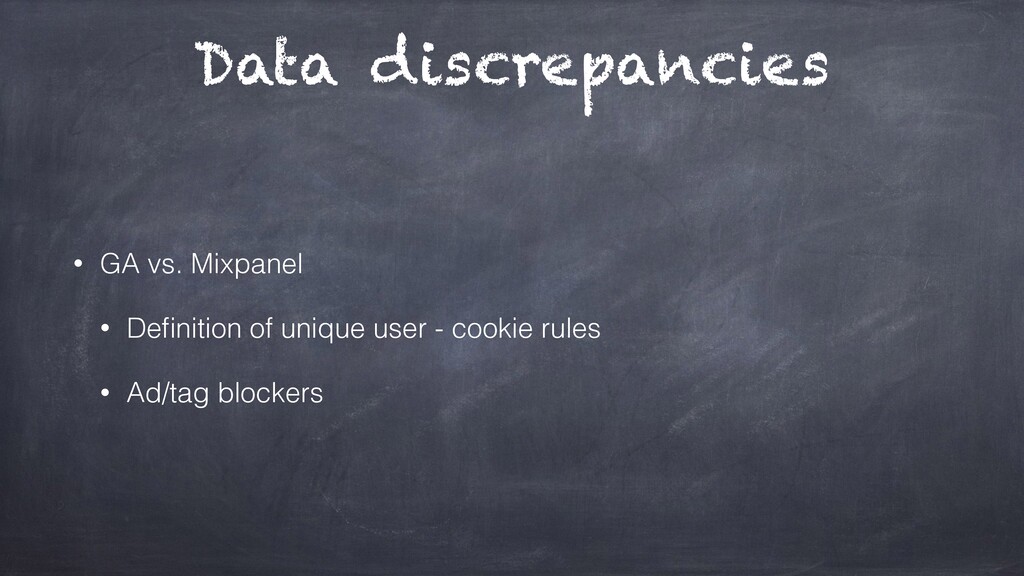
So summing up here, data discrepancies, Google Analytics versus Mixpanel, if we understand the definitions, they have different cookie rules, different lifetimes of the user. The numbers I showed before from Mixpanel versus our own database, out by six percent, We believe that's attributed to ad blockers, where people using ad blockers can actually block analytics tools as well.
So that client side tracking, we actually saw a dip of six percent in the metric there. Other things, maybe the page didn't finish loading. If our page load time is slow, people may get bored and hit the back button. So it will count in our Google AdWords or marketing dashboards as a click and a visit, but maybe our tag manager hasn't fired and we haven't recorded that person who's landed on our website.
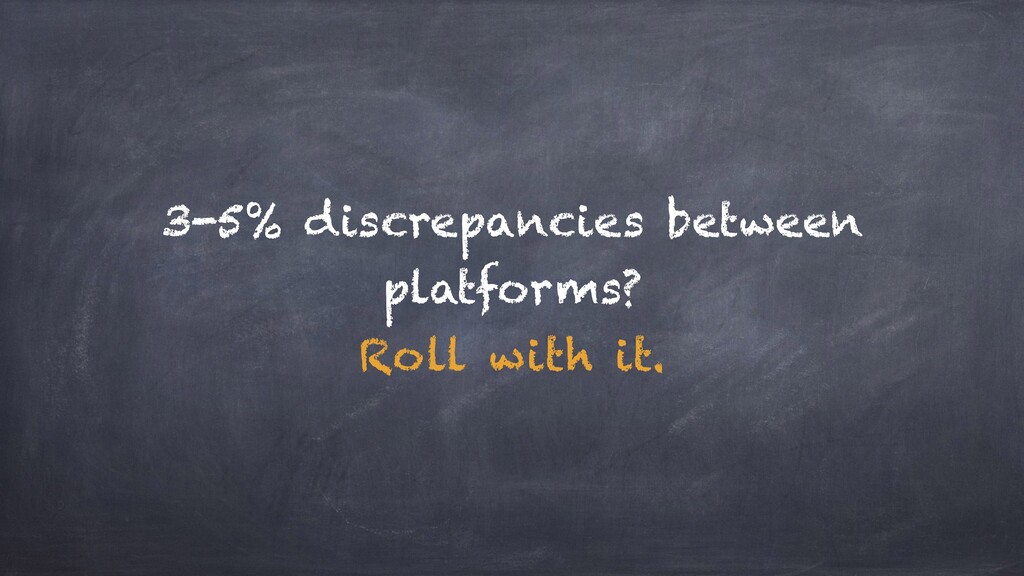
Or cross browser bugs, for example. So, finally, for me, the final stage of analytics grief is this acceptance, where what I find works is, if we have a low level of discrepancy between tools, maybe three to five percent, that's okay. We can normally roll with it, live with it, so long as we make sure that we're aware of it and it's not scuffering any statistical significance in any analysis we may be doing.
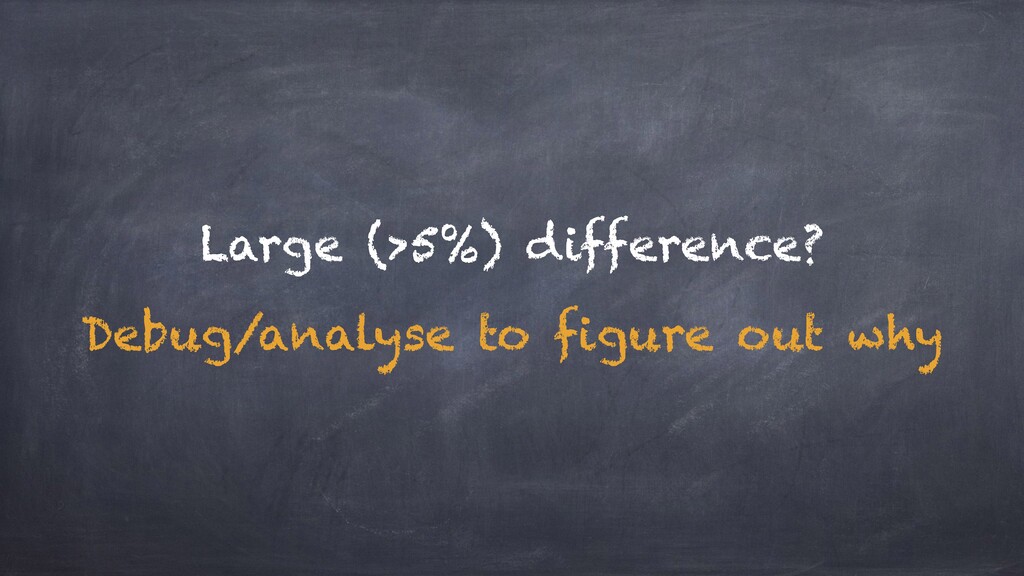
If we have larger differences, that's when we can try to debug and analyse and dive into some of these potential root causes. We understand have we got the correct data? Do we understand the definitions that we're dealing with? That's pretty much it for this morning.
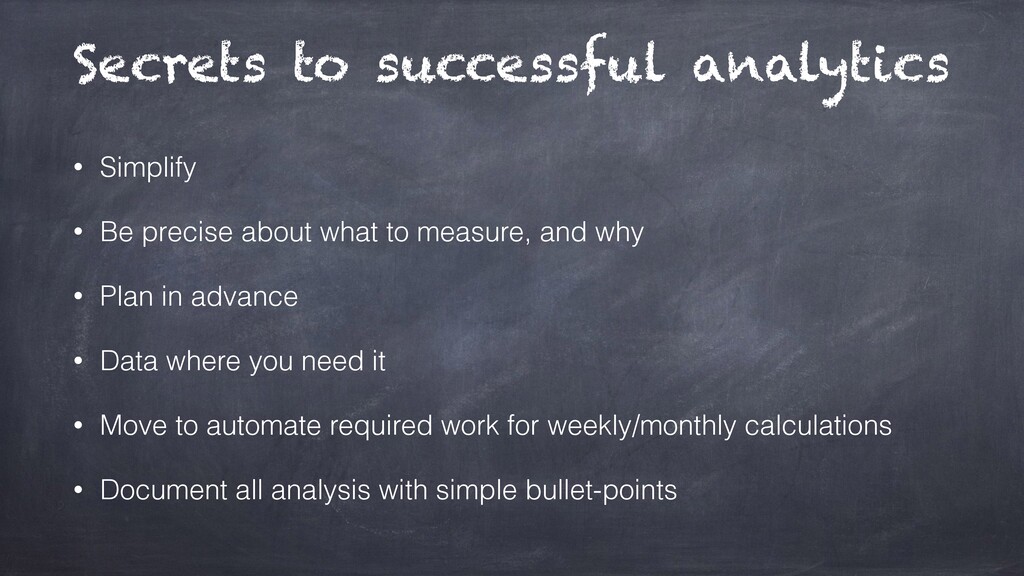
I hope that was helpful for you. In terms of takeaways, starting with your questions and hypotheses, being precise about what you want to measure and why. Planning in advance so we can make sure we're tracking those marketing campaigns, at what point will it succeed, at what point will it fail.
Only automate once we have something that we want to know that works and want to scale up. And finally, making sure we're just making quick bullet point documentation of everything we learn. And to remember, the numbers tell us what happened, but they don't tell us why.
So all of this analytics is fantastic, but it's no substitute for customer research and creativity and all of these other great things we need to do as well. Thanks very much. Good luck. I'm an absolute geek about this stuff, so please don't hesitate to come grab me throughout the day or this evening.
I'd love to chat one on one. So, thank you.